Microbiome Network Inference: A Comprehensive Guide to Methods, Applications, and Validation
This article provides a comprehensive overview of the rapidly evolving field of microbiome network inference, a key exploratory technique for understanding complex microbial interactions and their implications for human health...
Microbiome Network Inference: A Comprehensive Guide to Methods, Applications, and Validation
Abstract
This article provides a comprehensive overview of the rapidly evolving field of microbiome network inference, a key exploratory technique for understanding complex microbial interactions and their implications for human health and disease. Aimed at researchers, scientists, and drug development professionals, it covers foundational concepts, from defining microbial interactions and the challenges of compositional data to the biological interpretation of network edges. The review critically assesses a spectrum of methodological approaches, including correlation-based methods, conditional dependence models like SPIEC-EASI and OneNet, and the practical workflow for network construction. It further addresses critical troubleshooting and optimization challenges, such as data preprocessing, handling rare taxa, and mitigating environmental confounders. Finally, the article evaluates advanced validation frameworks and comparative studies, highlighting emerging standards like cross-validation and consensus methods to ensure biological reproducibility and robust network inference for therapeutic discovery.
The Blueprint of Microbial Societies: Foundations of Network Inference
In microbiome research, accurately defining microbial interactions is fundamental to understanding community assembly, stability, and function. The field has progressively evolved from analyzing simple correlation patterns to inferring conditional dependence, which more accurately represents direct ecological interactions by accounting for the compositional nature of sequencing data and controlling for confounding effects of other community members [1] [2]. This shift is critical for distinguishing direct microbial interactions from indirect associations mediated through other taxa, enabling more biologically meaningful insights into community dynamics [3]. Traditional correlation-based approaches often produce spurious results due to data compositionality, where relative abundances sum to a constant, thereby necessitating more sophisticated statistical frameworks that can address these inherent data constraints [1] [4].
The advancement of network inference methods has transformed our ability to decipher complex microbial relationships from high-dimensional microbiome datasets. These methods now incorporate specialized approaches to handle compositional data, sparsity constraints, and longitudinal dynamics, providing powerful tools for predicting community behavior and identifying keystone species [5] [6]. This progression from correlation to conditional dependence represents a paradigm shift in microbial ecology, enabling researchers to move beyond descriptive associations toward mechanistic understanding of microbial community dynamics.
Methodological Evolution: From Correlation to Conditional Dependence
Limitations of Correlation-Based Approaches
Correlation-based methods, including Pearson and Spearman correlation coefficients, were among the first computational approaches used to infer microbial interactions from abundance data. These methods estimate pairwise associations without accounting for the influence of other taxa in the community, thus conflating direct and indirect interactions [3]. A significant limitation arises from the compositional nature of microbiome data, where relative abundances are constrained to a constant sum (e.g., 100% in proportional data). This property introduces spurious correlations that do not reflect true biological interactions [1] [2]. Furthermore, correlation methods are particularly prone to detecting false associations among low-abundance taxa and require subjective threshold selection to define significant interactions, potentially leading to misinterpretations of network structures [4].
Foundations of Conditional Dependence Methods
Conditional dependence methods address these limitations by estimating interactions between pairs of taxa while controlling for the effects of all other taxa in the community [3]. This approach effectively separates direct interactions from indirect associations mediated through other community members. The mathematical foundation of these methods often relies on partial correlations or inverse covariance estimation, which provide a more accurate representation of direct microbial relationships by accounting for the multivariate nature of microbial communities [1] [2]. Under conditional dependence frameworks, a zero entry in the inverse covariance matrix indicates conditional independence between corresponding taxa given the rest of the community, thereby reflecting true direct interactions [1].
Table 1: Comparison of Microbial Interaction Inference Methods
| Method Type | Statistical Foundation | Handles Compositionality | Distinguishes Direct vs. Indirect Interactions | Example Methods |
|---|---|---|---|---|
| Correlation-Based | Pearson/Spearman correlation | No | No | Conventional co-occurrence networks |
| Conditional Dependence | Partial correlation/Inverse covariance | Yes | Yes | gCoda, SPIEC-EASI, LUPINE |
| Longitudinal Network Inference | PLS regression/PCA | Yes | Yes | LUPINE |
| Machine Learning-Based | Graph neural networks | Varies | Varies | Graph neural network models |
Advanced Conditional Dependence Frameworks
gCoda: Compositional Data Analysis
The gCoda method represents a significant advancement in conditional dependence inference by explicitly addressing the compositional nature of microbiome data through a logistic normal distribution model [1]. This approach assumes that observed compositional data are generated from latent absolute abundances that follow a multivariate normal distribution in log space. The method incorporates a sparse inverse covariance estimation with penalized maximum likelihood to address the high dimensionality of microbiome data, where the number of operational taxonomic units (OTUs) often exceeds sample size [1].
The key innovation of gCoda lies in its transformation of the interaction inference problem into estimating the structure of the inverse covariance matrix (precision matrix) of the latent variables. The optimization problem is solved using a Majorization-Minimization algorithm that guarantees decrease of the objective function until reaching a local optimum [1]. Simulation studies demonstrate that gCoda outperforms existing methods like SPIEC-EASI in edge recovery of inverse covariance for compositional data across various scenarios, providing more accurate inference of direct microbial interactions [1].
LUPINE: Longitudinal Network Inference
For longitudinal microbiome studies, LUPINE represents a novel approach that leverages conditional independence and low-dimensional data representation to infer microbial networks across time points [3]. This method incorporates information from all previous time points, enabling capture of dynamic microbial interactions that evolve over time. LUPINE utilizes projection to latent structures regression to maximize covariance between current and preceding time point datasets, effectively modeling the temporal dynamics of taxon interactions [3].
The methodology includes three variants: single time point modeling using principal component analysis, two time point modeling using PLS regression, and multiple time point modeling using generalized PLS for multiple data blocks [3]. This flexibility allows researchers to adapt the method based on their experimental design and specific research questions. LUPINE has been validated across multiple case studies including mouse and human studies with varying intervention types and time courses, demonstrating its robustness for different experimental designs [3].
Table 2: Performance Comparison of Network Inference Methods
| Method | Data Type | Computational Approach | Key Advantages | Reported Performance |
|---|---|---|---|---|
| gCoda | Cross-sectional | Penalized maximum likelihood with MM algorithm | Explicitly models compositional data; handles sparsity | Outperforms SPIEC-EASI in edge recovery under various scenarios [1] |
| LUPINE | Longitudinal | PLS regression with sequential modeling | Incorporates temporal dynamics; suitable for small sample sizes | Robust performance across multiple case studies; identifies relevant taxa [3] |
| Graph Neural Networks | Longitudinal | Graph convolution and temporal convolution layers | Predicts future community dynamics; captures relational dependencies | Accurately predicts species dynamics up to 10 time points ahead (2-4 months) [6] |
| RMT-Based Networks | Cross-sectional | Random Matrix Theory | Identifies keystone taxa; minimizes subjective thresholds | Reveals structural differences not detected by diversity metrics [4] |
Experimental Protocols
Protocol 1: Implementing gCoda for Microbial Interaction Inference
Purpose: To infer direct microbial interactions from compositional microbiome data using the gCoda framework.
Reagents and Materials:
- Normalized relative abundance data (e.g., proportions, centered log-ratio transformed)
- Computational environment with R installed
- gCoda package (available under LGPL v3)
Procedure:
- Data Preprocessing:
- Normalize raw sequence counts to relative abundances summing to 1
- Apply centered log-ratio transformation to address compositionality
- Standardize variables to zero mean and unit variance
Parameter Tuning:
- Set tuning parameters (λ1, λ2) to balance model fitting and sparsity
- Use cross-validation to select optimal penalty parameters
- Initialize Ω as a positive definite matrix
Model Optimization:
- Implement the Majorization-Minimization algorithm to solve the optimization problem
- Iterate until objective function convergence
- Ensure positive definiteness of the estimated Ω matrix
Network Construction:
- Extract non-zero entries from the estimated inverse covariance matrix
- Apply significance thresholding to identify robust interactions
- Visualize resulting network using appropriate software (e.g., Cytoscape)
Interpretation: Non-zero entries in the estimated Ω matrix represent direct conditional dependencies between microbial taxa after accounting for compositionality and controlling for all other taxa in the community [1].
Protocol 2: Longitudinal Network Inference with LUPINE
Purpose: To infer microbial networks across multiple time points using the LUPINE framework.
Reagents and Materials:
- Longitudinal microbiome abundance data across multiple time points
- R statistical environment
- LUPINE package (publicly available)
Procedure:
- Data Structuring:
- Organize abundance data into time-point specific matrices (X_t)
- Account for library size variations between samples
- Group samples by experimental conditions if applicable
Model Selection:
- For single time point analysis: Use PCA-based approach (LUPINE_single)
- For two time points: Implement PLS regression maximizing covariance between consecutive time points
- For multiple time points: Apply generalized PLS for multiple data blocks
Partial Correlation Estimation:
- For taxa pair (i,j), regress against one-dimensional approximation of other taxa (X^-(i,j))
- Use first principal component of control taxa to avoid high-dimensionality issues
- Calculate partial correlations from regression residuals
Network Significance Testing:
- Apply permutation-based significance thresholds
- Control for multiple testing using false discovery rate correction
- Compare networks across time points using appropriate metrics
Interpretation: Significant edges in LUPINE networks represent conditional dependencies between taxa that persist across specified time intervals, providing insights into stable microbial interactions within dynamic communities [3].
Research Reagent Solutions
Table 3: Essential Research Reagents and Computational Tools
| Item | Function/Application | Specifications |
|---|---|---|
| Power Soil DNA Isolation Kit | DNA extraction from complex microbial samples | Effective lysis of diverse microbial cells; suitable for fecal and environmental samples [5] [4] |
| 16S rRNA gene primers | Amplification of bacterial and archaeal target regions | Target V1-V3 (Bac9F/Ba515Rmod1) or other hypervariable regions; design impacts taxonomic resolution [4] |
| Illumina MiSeq platform | High-throughput sequencing of amplicon libraries | 2×250 bp paired-end sequencing; suitable for microbiome profiling studies [5] [4] |
| QIIME2 pipeline | Processing and analysis of raw sequencing data | Version 2019.10 or later; includes DADA2 for quality control and ASV generation [4] |
| SILVA database | Taxonomic classification of sequence variants | Version 132 or later; provides comprehensive rRNA reference database [4] |
| R statistical environment | Implementation of network inference methods | Essential for running gCoda, LUPINE, and other compositional data analysis tools [1] [3] |
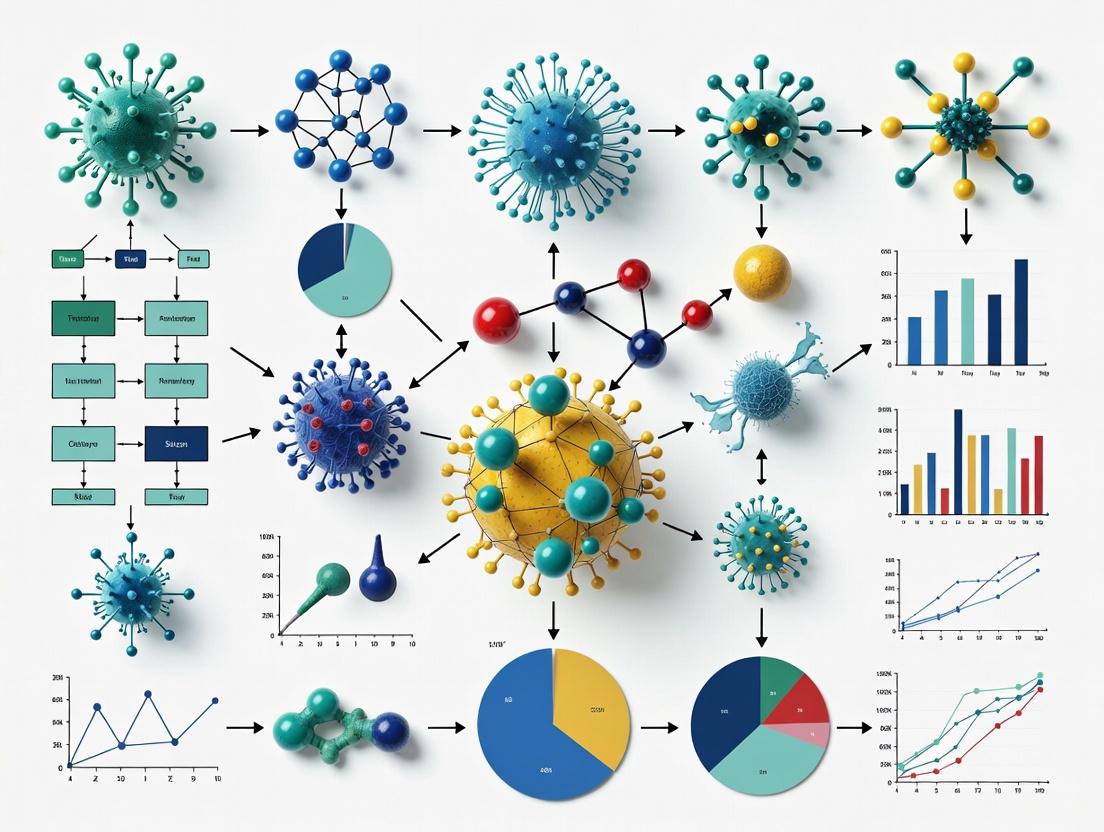
Workflow Visualization
Microbial Network Inference Workflow: This diagram illustrates the sequential process for inferring microbial interactions from raw sequencing data to biological interpretation, highlighting the critical decision point between correlation and conditional dependence approaches.
Applications and Case Studies
Environmental Gradient Analysis
A comprehensive study of bacterial, archaeal, and microeukaryotic communities across subtropical coastal waters demonstrated the utility of conditional dependence networks for revealing biogeographic patterns [5]. Researchers collected surface water samples from 99 stations across inshore, nearshore, and offshore zones in the East China Sea, analyzing co-occurrence networks for each domain. The study revealed that network complexity was highest for bacteria, while modularity was highest for archaeal networks [5]. Notably, all three domains showed consistent biogeographic patterns across environmental gradients, with the highest intensity of microbial co-occurrence in nearshore zones experiencing intermediate terrestrial impacts. Archaea, particularly Thaumarchaeota Marine Group I, occupied central positions in inter-domain networks, serving as hubs connecting different network modules across environmental gradients [5].
Predicting Community Dynamics
Graph neural network models have demonstrated remarkable capability in predicting future microbial community dynamics using historical relative abundance data [6]. A study of 24 wastewater treatment plants involving 4,709 samples collected over 3-8 years showed that these models could accurately predict species dynamics up to 10 time points ahead (2-4 months), and sometimes up to 20 time points (8 months) [6]. The approach utilized graph convolution layers to learn interaction strengths between taxa, temporal convolution layers to extract temporal features, and fully connected neural networks to predict future relative abundances. When tested on the human gut microbiome, the method maintained predictive accuracy, demonstrating generalizability across microbial ecosystems [6].
Host-Microbe-Drug Interactions
Advanced computational frameworks like DHCLHAM utilize dual-hypergraph contrastive learning with hierarchical attention mechanisms to predict microbe-drug interactions [7] [8]. This approach integrates multiple similarity metrics, including functional similarity of medicinal chemical attributes and microbial genomes, to construct comprehensive interaction networks. The model employs a dual-hypergraph structure with K-Nearest Neighbors and K-means Optimizer algorithms, combined with contrastive learning to enhance representation of heterogeneous hypergraph space [7]. On benchmark datasets, this approach achieved AUC and AUPR scores of 98.61% and 98.33%, respectively, significantly outperforming existing methods and providing valuable insights for personalized medicine and drug development [7] [8].
Advanced Visualization Techniques
Advanced Hypergraph Learning Framework: This diagram illustrates the sophisticated DHCLHAM pipeline for predicting microbe-drug interactions, showcasing the integration of hypergraph structures with contrastive learning and attention mechanisms for enhanced prediction accuracy.
In microbial ecology, networks provide a powerful framework for moving beyond simple taxonomic lists to understanding the complex web of interactions within microbial communities. These networks are mathematically represented as graphs, where nodes (vertices) represent microbial taxa (e.g., species, genera), and edges (links) represent the statistical associations or inferred ecological interactions between them [9]. The structure of these networks—which nodes are connected and how strongly—reveals fundamental ecological organization that governs community stability, function, and its impact on the host environment.
Constructing these networks from microbiome sequencing data presents unique computational challenges. The data are inherently compositional, meaning that sequencing technologies capture relative abundances rather than absolute cell counts, making correlations difficult to interpret [9]. Additionally, microbiome data is often sparse (containing many zero values) and high-dimensional, with far more microbial taxa than samples, requiring specialized statistical methods to distinguish robust biological signals from noise [10] [9]. Despite these challenges, network analysis has revealed crucial insights, demonstrating that the contributions of taxa to microbial associations are disproportionate to their abundances, and that rarer taxa play an integral role in shaping community dynamics [9].
Conceptual Framework: Nodes and Edges
Nodes (Vertices)
In a microbial association network, each node corresponds to a defined biological entity, typically a microbial taxon. The specific taxonomic level (e.g., species, genus, phylum) is a critical decision in the network inference process. While species-level networks offer high resolution, the analytical choice depends on the sequencing depth, reference database completeness, and the biological question at hand. Nodes can possess attributes that provide additional layers of information for interpretation. These attributes often include:
- Taxonomic lineage: The full classification of the taxon (Kingdom, Phylum, Class, etc.).
- Mean relative abundance: The average proportion of the taxon across all samples.
- Prevalence: The percentage of samples in which the taxon is detected.
In network visualization tools, these node attributes can be mapped to visual properties such as size (e.g., proportional to abundance), color (e.g., by phylum), or shape to create intuitive and information-rich graphical representations [11].
Edges (Links)
Edges represent the statistical associations or inferred ecological interactions between pairs of nodes. These associations can be broadly categorized into two types, each with distinct biological interpretations:
- Positive associations (often visualized as green or blue edges) suggest potential mutualistic, cooperative, or cross-feeding relationships where taxa co-occur more frequently than expected by chance.
- Negative associations (often visualized as red edges) suggest potential competitive or antagonistic relationships where the presence of one taxon is linked to the absence of another.
Crucially, the method used to infer the network determines what an edge represents. The two primary classes of methods are:
- Correlation-based methods: These infer edges based on simple co-occurrence or co-abundance patterns. While computationally simpler, they are highly susceptible to indirect correlations, where a correlation between Taxa A and B is driven by a third, unobserved factor Taxon C [10] [9].
- Conditional dependence-based methods: These more advanced methods, such as those based on Gaussian Graphical Models (GGMs), infer edges based on conditional independence. An edge between Taxa A and B exists if they are correlated after accounting for the abundances of all other taxa in the network [10]. This helps to eliminate spurious edges and is better at approximating direct ecological interactions.
Table 1: Interpretation of Network Edges Based on Inference Method.
| Inference Method Class | What an Edge Represents | Key Advantage | Key Limitation |
|---|---|---|---|
| Correlation-Based | Total dependency (Co-occurrence) | Computational simplicity | Prone to indirect, spurious correlations |
| Conditional Dependence-Based | Direct interaction (Conditional dependence) | Filters out indirect effects | Higher computational cost; more complex implementation |
Computational Protocols for Network Inference
Protocol 1: Inferring a Co-occurrence Network with SPIEC-EASI
SPIEC-EASI (Sparse Inverse Covariance Estimation for Ecological Association Inference) is a widely adopted method that tackles compositionality and sparsity to infer more reliable, sparse microbial networks [9]. The following protocol outlines its application.
1. Data Preprocessing and Normalization
- Input: An
n x pmicrobial abundance matrix (n samples, p taxa). - Quality Filtering: Remove taxa that are present in fewer than a specified percentage of samples (e.g., 10-20%) to reduce noise from rare species.
- Normalization: Apply a variance-stabilizing transformation. While SPIEC-EASI has built-in handling for compositionality, a common preparatory step is to perform a Centered Log-Ratio (CLR) transformation on the filtered data [10]. This transformation maps the compositional data from the simplex to a real-space Euclidean geometry, making it more amenable to correlation-based methods.
2. Network Inference via Neighborhood Selection
- Method Selection: Within the SPIEC-EASI framework, select the MB (Meinshausen-Bühlmann) approach for stability selection [10].
- Model Fitting: The method estimates the sparse inverse covariance matrix (precision matrix) of the data. A non-zero entry in this matrix indicates a conditional dependence between two taxa, forming an edge in the network.
- Stability Selection: This resampling procedure is used to tune the regularization parameter
λ, which controls network sparsity. The data is subsampled multiple times, and networks are inferred for a range ofλvalues. The finalλ*is chosen based on the stability of the resulting edges across subsamples [10].
3. Network Construction and Edge Selection
- Edge Weights: The non-zero entries in the final selected precision matrix provide the weights for the edges in the network.
- Thresholding: Only edges that persist across a high proportion of resampling iterations (e.g., >95%) are retained, ensuring that the final network consists of robust, reproducible associations.
Figure 1: SPIEC-EASI Network Inference Workflow.
Protocol 2: Building a Consensus Network with OneNet
Given that different inference methods can yield vastly different networks from the same dataset, consensus methods like OneNet have been developed to produce more robust and reliable networks [10].
1. Multi-Method Inference
- Input: The preprocessed abundance matrix from Protocol 1, Step 1.
- Parallel Inference: Apply seven different GGM-based inference methods (Magma, SpiecEasi, gCoda, PLNnetwork, EMtree, SPRING, ZiLN) to the same dataset. Each method will output a network with a set of edges and associated scores (e.g., selection probability or penalty level) [10].
2. Edge Selection Frequency Calculation
- For each of the seven methods, calculate a sequence of selection frequency values for every possible edge. This involves a resampling procedure where the network is inferred on multiple subsamples of the data for different penalty parameters [10].
- The selection frequency for an edge
eat a parameterλ_kis:f_e^k = (1/B) * Σ_{b=1 to B} 1{e ∈ G_b,k}, whereBis the number of subsamples and1{}is the indicator function [10].
3. Consensus Network Assembly
- The selection frequencies for each edge from all seven methods are combined.
- A threshold is applied to the combined selection frequencies. Only edges that exceed this threshold (i.e., edges that are consistently selected by multiple methods across resampling iterations) are included in the final consensus network [10]. This approach generally results in sparser networks with higher precision than any single method.
Figure 2: OneNet Consensus Network Workflow.
Protocol 3: Analyzing Longitudinal Data with LUPINE
For time-series microbiome data, LUPINE (LongitUdinal modelling with Partial least squares regression for NEtwork inference) is a specialized method that leverages information from all past time points to capture dynamic microbial interactions [12].
1. Data Structuring
- Input: A longitudinal abundance matrix where samples are collected from the same subjects over multiple time points.
- Formatting: Structure the data to model the abundance of each taxon at time
tas a function of the abundances of all other taxa at previous time point(s)t-1(ort-n).
2. Model Fitting
- LUPINE uses Partial Least Squares (PLS) regression, a technique suited for datasets with a large number of correlated predictor variables (i.e., many taxa) and a small sample size [12].
- For each taxon, a PLS model is built to predict its abundance at time
tbased on the microbial community composition at timet-1.
3. Network Interpretation
- The regression coefficients from the PLS models are interpreted as the direction and strength of influence that one taxon has on the future abundance of another.
- These directed influences form a longitudinal network, providing insights into successional patterns, microbial disturbances, and the temporal stability of interactions [12].
Essential Tools and Reagents for Microbial Network Analysis
Table 2: The Scientist's Toolkit for Microbial Network Inference.
| Tool/Reagent Category | Example | Function and Application Note |
|---|---|---|
| Network Inference Software (R/Python) | SpiecEasi [9], OneNet [10], LUPINE [12] | Core statistical environment for executing inference algorithms. OneNet combines 7 methods for robust consensus. LUPINE is designed for longitudinal data. |
| Visualization & Analysis Platform | Cytoscape [11], NetCoMi [10] | Cytoscape provides advanced network visualization and exploration. NetCoMi offers an all-in-one R platform for inference and comparison. |
| Data Preprocessing Tool | Kraken2/Bracken [9], Trimmomatic [9] | Tools for taxonomic assignment and abundance quantification (Kraken2/Bracken) and read quality control (Trimmomatic). |
| Normalization Technique | Centered Log-Ratio (CLR) [10], GMPR [10] | Compositional data transformations. CLR is common for many methods, while GMPR (Geometric Mean of Pairwise Ratios) is used for specific models like PLNnetwork. |
| Stability Assessment Method | Stability Selection (StARS) [10] | A resampling-based procedure for robust tuning of sparsity parameters and edge selection, critical for reproducible networks. |
Application in Disease Research
Network analysis has proven particularly valuable in differentiating diseased from healthy microbiomes. A meta-analysis of gut microbiomes across multiple diseases revealed that dysbiotic states are characterized by distinct network topologies [9]. Key findings include:
- Differentiation of Bacterial Phyla: The organization and connectivity of different bacterial phyla within the network change significantly in disease.
- Enrichment of Proteobacteria: Interactions involving Proteobacteria, a phylum often containing opportunistic pathogens, are frequently enriched in diseased networks [9].
- Identification of Microbial Guilds: Network analysis in liver-cirrhosis patients, for instance, successfully identified a "cirrhotic cluster"—a guild of bacteria associated with a degraded clinical host status [10]. Such guilds represent groups of microbes that co-occur and may interact synergistically, offering potential multi-taxa biomarkers for disease diagnosis and therapeutic targeting.
Why Network Analysis? Uncovering Guilds, Keystones, and Community Structure
Microbial communities are complex systems where the interactions between members are as critical as their individual identities. Network analysis provides a powerful framework to move beyond mere catalogues of "who is there" to understand the dynamic and interconnected nature of these communities. By representing microorganisms as nodes and their statistical associations as edges, this approach transforms complex microbiome data into interpretable maps of community structure. These maps are indispensable for identifying key ecological entities—keystone taxa that exert disproportionate influence on community stability and function, and guilds of organisms that work in concert to perform critical ecosystem processes. Within the context of microbiome network inference, this methodology reveals the hidden architecture of microbial communities, offering insights crucial for predicting ecosystem responses to perturbation and identifying high-value targets for therapeutic intervention.
Key Concepts: Guilds, Keystone Taxa, and Hubs
Keystone Taxa are functionally defined as taxa that have a profound effect on microbiome structure and functioning irrespective of their abundance [13]. Their removal—whether computational or experimental—is predicted to cause a drastic shift in the community composition and its metabolic output. The table below summarizes the core concepts central to network-level analysis.
Table 1: Key Ecological Concepts in Microbiome Network Analysis
| Concept | Definition | Ecological Role | Identification Method |
|---|---|---|---|
| Keystone Taxa | Taxa that exert a considerable influence on the microbial community structure and function, disproportionate to their abundance [13]. | "Ecosystem engineers" that drive community composition and functional output; their loss can collapse the community structure. | High values of betweenness centrality in co-occurrence networks; Zi-Pi plot analysis; causal inference from time-series data [13] [14] [15]. |
| Microbial Hubs | Highly interconnected taxa within a network that form central connection points for multiple other taxa [16]. | Mediate the effects of host genotype and abiotic factors on the broader microbial community via microbe-microbe interactions [16]. | High values of degree (number of connections) and closeness centrality in co-occurrence networks. |
| Guilds | Groups of microbial taxa that utilize the same environmental resources in a similar way, often identified as tightly connected sub-networks. | Perform coordinated functions (e.g., hydrocarbon degradation, nitrogen cycling); provide functional redundancy and resilience. | Module or community detection algorithms within networks (e.g., Louvain method); clustering based on correlation patterns. |
The relationship between these concepts is often interactive. For instance, a keystone guild is a group of co-occurring keystone taxa that work together to drive a community function. One study demonstrated that Sulfurovum formed a mutualistic keystone guild with PAH-degraders like Novosphingobium and Robiginitalea, significantly enhancing the removal of the pollutant benzo[a]pyrene [14]. Furthermore, hub taxa can act as keystones; the pathogen Albugo and the yeast Dioszegia were identified as microbial "hubs" that strongly controlled the structure of the phyllosphere microbiome across kingdoms [16].
Experimental Protocols for Network Inference and Validation
A robust workflow for inferring and validating ecological networks from microbiome data involves sequential stages of data processing, network construction, statistical analysis, and experimental validation.
Protocol 3.1: Co-occurrence Network Construction and Analysis
This protocol outlines the process for building and analyzing a microbial co-occurrence network from 16S rRNA gene amplicon or metagenomic sequencing data, adapted from established methodologies [14] [15].
Key Research Reagents & Materials:
- High-Quality Sequencing Data: Raw FASTQ files from 16S rRNA gene amplicon or shotgun metagenomic sequencing of multiple samples.
- Bioinformatics Pipeline: Tools like QIIME 2, mothur, or HUMAnN for processing raw reads into a feature table (e.g., ASVs or species-level abundances).
- Computational Environment: R or Python with necessary libraries (e.g.,
vegan,igraph,FastSpar). - Correlation Algorithm: A tool designed for compositional data, such as FastSpar or SparCC [15].
Procedure:
- Data Preprocessing: Process raw sequencing reads to obtain a count table of microbial features (OTUs, ASVs, or species) across all samples. Normalize the data (e.g., by converting to relative abundance) and apply a prevalence filter (e.g., retain features present in >10% of samples).
- Correlation Calculation: Calculate all pairwise correlations between microbial taxa using the FastSpar algorithm. Use recommended settings:
--iterations 100,--exclude_iterations 20,--threshold 0.1, and--number 1000for bootstrap analysis to assess significance [15]. - Network Construction: Create an undirected network where nodes represent microbial taxa. Establish an edge between two nodes if their correlation is statistically significant (p < 0.01 after multiple test correction) and meets a minimum correlation strength threshold (e.g., |r| > 0.6).
- Topological Analysis: Calculate network properties for each node using the
igraphpackage: - Identify Keystone Taxa: Rank taxa based on their betweenness centrality. Taxa in the top 5-10% are putative keystones. Validate this list using a Zi-Pi plot, which classifies nodes based on their within-module connectivity (Zi) and among-module connectivity (Pi). Module hubs have Zi > 2.5; Network hubs have Zi > 2.5 and Pi > 0.62 [13].
Protocol 3.2: The 3C-Strategy for Characterizing Keystone Taxa
This integrated strategy, combining co-occurrence network analysis, comparative genomics, and co-culture, provides a powerful framework for moving from correlation to causation in identifying keystone functions [14].
Procedure:
- Trigger and Track: Set up microcosm experiments with environmental samples, manipulating a key factor (e.g., adding a pollutant like BaP or a nutrient like nitrate). Track microbial community dynamics over time via sequencing to trigger role transitions in keystone taxa [14].
- Co-occurrence Network Analysis (First C): Construct and compare networks from the different treatments as described in Protocol 3.1. Identify taxa that transition to keystone roles (high betweenness) under specific conditions.
- Comparative Genomics (Second C): Perform metagenomic sequencing on selected samples. Reconstruct Metagenome-Assembled Genomes (MAGs) of the identified putative keystone taxa. Annotate genes in these MAGs to infer their metabolic potential (e.g., stress resistance, nutrient cycling, degradation pathways) and understand the mechanistic basis for their keystone role [14].
- Co-culture (Third C): a. Capture: Isolate the putative keystone taxon and a key functional microbe (e.g., a primary degrader) from the same environment using cultivation-based methods. b. Label: Tag the functional microbe with a reporter gene like eGFP for visualization. c. Validate: Establish co-cultures of the keystone taxon and the functional microbe under stress conditions (e.g., pollutant toxicity). Measure and compare functional outputs (e.g., degradation efficiency, cell growth, stress marker removal) in co-culture versus mono-culture to experimentally verify the facilitating role of the keystone taxon [14].
Visualization of Workflows and Relationships
Effective visualization is critical for interpreting the complex relationships and workflows in network analysis.
Diagram 1: A workflow integrating standard network analysis with the 3C-strategy for keystone taxon validation.
Diagram 2: Conceptual model of a keystone guild, illustrating the mutualistic interactions between a keystone taxon (Sulfurovum) and primary degraders that enhance ecosystem function.
The Scientist's Toolkit: Essential Reagents and Materials
Table 2: Key Research Reagent Solutions for Microbiome Network Analysis
| Item | Function / Application | Example / Specification |
|---|---|---|
| FastSpar Software | Calculates robust correlations from compositional microbiome data for network construction. | Uses a linear Pearson correlation on log-transformed components; requires --iterations 100 and --number 1000 for bootstrap significance [15]. |
| Metagenome-Assembled Genomes (MAGs) | Reconstructs genomes from complex metagenomic data to infer the metabolic potential of uncultured keystone taxa. | Generated from shotgun metagenomic sequencing using binning tools (e.g., MetaBAT2, MaxBin2). Critical for the "Comparative Genomics" step in the 3C-strategy [14]. |
| eGFP-labeling System | Tags and visualizes specific bacterial strains to track their growth and interactions in co-culture experiments. | Used in the "Co-culture" step to monitor the response of a key degrader in the presence of a putative keystone taxon under stress [14]. |
| hiTAIL-PCR | Captures flanking sequences of inserted genes, used to track and identify specific microbial degraders in a community. | A method to capture key degraders (e.g., for PAHs) that can then be labeled and used in co-culture validation [14]. |
| SparCC Algorithm | An alternative to FastSpar for inferring correlation networks from compositional data. | Estimates correlations after accounting for the compositional nature of relative abundance data [15]. |
Network analysis has emerged as a cornerstone of modern microbial ecology, providing the analytical framework to move from patterns to processes. By enabling the systematic identification of keystone taxa and functional guilds, it reveals the organizing principles of complex microbial communities. The integrated 3C-strategy—coupling Co-occurrence networks, Comparative genomics, and Co-culture—provides a robust, causally-oriented pipeline to validate the function of these key players. For researchers and drug development professionals, this methodology is transformative. It offers a rational approach to identify high-value targets for next-generation probiotics, design synthetic microbial consortia for bioremediation of pollutants like HMW-PAHs, and develop therapies that aim to steer dysbiotic communities back to a healthy state by manipulating their keystone elements. Understanding the network structure of a microbiome is the first step towards learning how to re-engineer it for human and environmental health.
Microbiome network inference is a powerful tool for unraveling the complex interactions among microorganisms in various ecological niches, from the human gut to environmental habitats [17]. These analyses model microbial communities as networks where nodes represent microbial taxa and edges represent significant associations between them, revealing the ecosystem's structure and stability [17] [3]. However, two intrinsic properties of microbiome sequencing data present substantial analytical challenges: compositionality and sparsity.
Compositional data arises because sequencing techniques measure relative abundances rather than absolute cell counts. The data is constrained to a constant sum (e.g., proportions summing to 1 or counts summing to the sequencing depth), meaning an increase in one taxon's abundance necessarily causes an apparent decrease in others [17] [3]. This property leads to spurious correlations if analyzed with standard statistical methods [17]. Simultaneously, microbiome data is highly sparse, containing an excess of zeros due to many low-abundance or rare taxa that are undetected in most samples [17]. This sparsity challenges the reliability of correlation estimates and network inference.
Table 1: Characteristics of microbiome datasets highlighting sparsity across different environments
| Dataset Name | Number of Taxa | Number of Samples | Sparsity (%) | Research Context |
|---|---|---|---|---|
| HMPv35 | 10,730 | 6,000 | 98.71 | Human body sites [18] |
| MovingPictures | 22,765 | 1,967 | 97.06 | Longitudinal human microbiome [18] |
| TwinsUK | 8,480 | 1,024 | 87.70 | Twin genetics study [18] |
| qa10394 | 9,719 | 1,418 | 94.28 | Sample preservation effects [18] |
| necromass | 36 | 69 | 39.78 | Soil decomposition [18] |
Table 2: Network inference methods addressing compositional and sparse data challenges
| Method | Approach | Handles Compositionality? | Handles Sparsity? | Longitudinal Data Support |
|---|---|---|---|---|
| LUPINE | Partial correlation with low-dimensional approximation [3] | Yes | Yes | Yes (specialized) |
| MDSINE2 | Bayesian dynamical systems with interaction modules [19] | Indirectly via modeling | Yes | Yes (specialized) |
| SpiecEasi | Precision-based inference [3] | Yes | Yes | No |
| SparCC | Correlation-based with compositionality awareness [3] | Yes | Limited | No |
| fuser | Fused Lasso for multi-environment data [18] | Yes | Yes | Limited |
Computational Frameworks for Robust Inference
LUPINE: Longitudinal Modeling with Partial Least Squares Regression
The LUPINE (LongitUdinal modelling with Partial least squares regression for NEtwork inference) framework addresses compositionality through partial correlation while accounting for the influence of other taxa [3]. Its innovation lies in using one-dimensional approximation of control variables via principal component analysis (PCA) or projection to latent structures (PLS) regression, making it suitable for scenarios with small sample sizes and few time points [3].
LUPINE network inference workflow
MDSINE2: Dynamical Systems Modeling with Bayesian Inference
MDSINE2 (Microbial Dynamical Systems Inference Engine 2) employs a Bayesian approach to learn ecosystem-scale dynamical systems models from microbiome time-series data [19]. It addresses data challenges through several key innovations: explicit modeling of measurement uncertainty in sequencing data and total bacterial concentrations, incorporation of stochastic effects in dynamics, and automatic learning of interaction modules—groups of taxa with similar interaction structures [19].
The Fuser Algorithm for Cross-Environment Inference
The fuser algorithm applies fused Lasso to microbiome network inference, enabling information sharing across environments while preserving niche-specific associations [18]. This approach is particularly valuable for analyzing datasets with multiple environmental conditions or experimental groups, as it generates distinct predictive networks for different niches while leveraging shared information to improve inference accuracy [18].
Experimental Protocols
Protocol: LUPINE_single for Cross-Sectional Data
Purpose: To infer robust microbial association networks from cross-sectional microbiome data while addressing compositionality and sparsity.
Materials:
- Microbial abundance data (OTU/ASV table)
- High-performance computing environment with R installed
- LUPINE_single software package
Procedure:
Data Preprocessing:
- Apply centered log-ratio (CLR) transformation or similar compositionality-aware normalization
- Filter rare taxa using prevalence and abundance thresholds (e.g., retain taxa present in >10% of samples)
- Optional: Impute zeros using Bayesian-multiplicative replacement or other sparse-data methods
Network Inference:
- For each taxon pair (i,j), extract the abundance vectors (X^i) and (X^j)
- Compute the first principal component of the control matrix (X^{-(i,j)}) containing all taxa except i and j
- Calculate the partial correlation between (X^i) and (X^j) conditional on the first principal component
- Repeat for all possible taxon pairs in the dataset
Significance Testing:
- Apply permutation-based significance testing (e.g., 1000 permutations)
- Adjust p-values for multiple testing using false discovery rate (FDR) control
- Retain only statistically significant associations after FDR correction (e.g., q-value < 0.05)
Network Construction:
- Create an adjacency matrix from significant partial correlations
- Apply a threshold to partial correlation coefficients to reduce false positives
- Construct the network graph with taxa as nodes and significant associations as edges [3]
Protocol: MDSINE2 for Longitudinal Data
Purpose: To infer microbial dynamics and interaction networks from longitudinal microbiome data with perturbations.
Materials:
- Longitudinal relative abundance data (16S rRNA or metagenomic sequencing)
- Total bacterial concentration measurements (from qPCR or flow cytometry)
- Sample metadata including perturbation timing
- MDSINE2 software package
Procedure:
Data Preparation:
- Align all samples by time and perturbation status
- Convert relative abundances to absolute abundances using total bacterial concentrations
- Perform quality control to remove poorly sampled time points
Model Training:
- Specify prior distributions for growth rates, interaction strengths, and perturbation responses
- Initialize interaction modules using phylogenetic information or clustering
- Run Markov Chain Monte Carlo (MCMC) sampling to infer posterior distributions of parameters
Model Validation:
- Perform leave-one-subject-out cross-validation
- Assess forecast accuracy using root-mean-squared error (RMSE) of log abundances
- Compare against baseline methods (e.g., gLV-L2, gLV-net)
Network Analysis:
- Extract interaction networks from posterior means of interaction parameters
- Identify keystone taxa using betweenness centrality and interaction strength
- Evaluate community stability through eigenanalysis of the interaction matrix [19]
The Scientist's Toolkit: Research Reagent Solutions
Table 3: Essential computational tools and resources for microbiome network inference
| Tool/Resource | Type | Function | Application Context |
|---|---|---|---|
| LUPINE | R package | Longitudinal network inference | Handles small sample sizes, multiple time points [3] |
| MDSINE2 | Open-source software | Dynamical systems modeling | Bayesian inference of microbial interactions from time-series [19] |
| fuser | R/Python package | Multi-environment network inference | Preserves niche-specific signals while sharing information [18] |
| SAC Framework | Validation protocol | Same-All Cross-validation | Evaluates algorithm performance across environmental niches [18] |
| ColorBrewer 2.0 | Visualization tool | Color palette selection | Ensures accessible, colorblind-friendly network visualizations [20] |
| Chroma.js | Visualization tool | Color scale optimization | Creates perceptually balanced gradients for abundance visualizations [20] |
Advanced Visualization and Interpretation
Comprehensive workflow from raw data to interpretable networks
Effective visualization of microbial networks requires careful consideration of color and design. ColorBrewer 2.0 provides specialized color schemes for sequential, diverging, and qualitative data, ensuring that network nodes and edges are distinguishable while maintaining accessibility for colorblind readers [20]. For gradient-based visualizations of abundance data, the Chroma.js Color Scale Helper optimizes perceptual differences between steps, enabling accurate interpretation of microbial abundance patterns [20].
Network interpretation extends beyond visualization to topological analysis. Key metrics include degree centrality (number of connections per node), betweenness centrality (influence over information flow), and closeness centrality (efficiency of information spread) [17]. Additionally, identifying hub nodes (highly connected taxa), keystone species (disproportionate ecological impact), and network modules (strongly interconnected clusters) provides biological insights into community structure and stability [17].
Navigating compositional data and sparse datasets remains a core challenge in microbiome network inference, but methodological advances are steadily addressing these limitations. The integration of compositionality-aware statistical methods with Bayesian approaches that explicitly model uncertainty represents the current state-of-the-art. Emerging techniques like causal machine learning and Double ML show promise for moving beyond correlation to establish causal relationships in microbial communities [21]. As these methods mature and standardized validation frameworks like SAC gain adoption, microbiome network inference will become increasingly robust and reliable, ultimately enhancing its utility in therapeutic development and personalized medicine.
In microbiome research, network inference has become an indispensable tool for unraveling the complex dynamics of microbial communities. An edge in a microbial network represents a statistically inferred association between two microbial taxa or between a microbe and an environmental factor. This application note delineates the biological and ecological interpretations of network edges, providing a detailed protocol for their inference, validation, and contextualization within microbiome interaction studies. We further equip researchers with standardized workflows and analytical frameworks to enhance the rigor and biological relevance of network-based findings, ultimately supporting advancements in therapeutic development and microbiome engineering.
In microbial co-occurrence networks, nodes typically represent microbial taxa (e.g., species, genera, or OTUs/ASVs), while edges denote the statistical associations inferred between them based on their abundance patterns across multiple samples [22] [23]. These edges are not direct observations of interaction but are statistical inferences that suggest a potential biological or ecological relationship. The precise interpretation of an edge is contingent upon the experimental design, data preprocessing choices, and statistical inference methods employed [23] [24].
Understanding what an edge represents is critical because microbial interactions form the backbone of community dynamics and function. These interactions can influence host health, ecosystem stability, and therapeutic outcomes [22] [9]. Misinterpretation of edges can lead to flawed biological hypotheses; therefore, a rigorous approach to their inference and analysis is paramount.
Ecological Interpretation of Network Edges
Types of Ecological Interactions
The statistical associations captured by network edges can be mapped to several canonical forms of ecological relationships. These relationships are fundamentally defined by the net effect one microorganism has on the growth and survival of another [22].
Table 1: Ecological Interactions Represented by Network Edges
| Interaction Type | Effect of A on B | Effect of B on A | Potential Edge Interpretation |
|---|---|---|---|
| Mutualism | Positive (+) | Positive (+) | Positive co-occurrence edge; potential cross-feeding or synergism |
| Competition | Negative (–) | Negative (–) Negative co-occurrence edge; competition for resources or space | |
| Commensalism | Positive (+) | Neutral (0) | Directed or asymmetric edge; A benefits B without being affected |
| Amensalism | Negative (–) | Neutral (0) | Directed or asymmetric edge; A inhibits B without being affected |
| Parasitism/Predation | Positive (+) | Negative (–) | Directed edge; one organism benefits at the expense of the other |
This framework allows researchers to move beyond mere statistical associations and begin formulating testable biological hypotheses about the nature of microbial relationships [22] [25].
Signed, Weighted, and Directed Networks
The biological interpretability of a network is enhanced by defining the properties of its edges:
- Signed Networks: Edges are designated as positive or negative, distinguishing between putative mutualistic/commensal interactions and competitive/amensal ones [22].
- Weighted Networks: The strength of the association is quantified, allowing for the inference of interaction strength. A stronger correlation might indicate a more robust or influential biological relationship [22].
- Directed Networks: Edges have a direction (A → B), representing a hypothesized causal or influential relationship from one taxon to another. Inferring direction typically requires longitudinal (time-series) data, as cross-sectional data alone can typically only support undirected networks [22].
Quantitative Foundations of Edge Inference
Statistical Measures for Pairwise Association
The foundation of any co-occurrence network is the pairwise association measure. The choice of metric is critical and should be guided by the data's characteristics [26].
Table 2: Common Association Measures for Microbial Edge Inference
| Association Measure | Formula (Simplified) | Data Applicability | Key Considerations |
|---|---|---|---|
| Pearson Correlation | ( r = \frac{\sum{i=1}^{n}(xi - \bar{x})(yi - \bar{y})}{\sqrt{\sum{i=1}^{n}(xi - \bar{x})^2}\sqrt{\sum{i=1}^{n}(y_i - \bar{y})^2}} ) | Normally distributed abundance data | Sensitive to outliers; assumes linearity. |
| Spearman's Rank Correlation | ( \rho = 1 - \frac{6 \sum d_i^2}{n(n^2 - 1)} ) | Non-normal data; ordinal abundance | Measures monotonic, not just linear, relationships. |
| SparCC | Based on log-ratio variances [26] | Compositional data (relative abundances) | Designed to mitigate compositionality artifacts. |
| Bray-Curtis Dissimilarity | ( BC{ij} = 1 - \frac{2C{ij}}{Si + Sj} ) | General abundance data; community ecology | Turns into similarity for network inference. |
Addressing Key Data Challenges
Microbiome data possess unique characteristics that, if unaddressed, can lead to spurious edges [23] [9].
- Compositionality: Data represent relative, not absolute, abundances, violating the independence assumption of many correlation metrics. This can be mitigated using compositionally aware methods like SparCC [26] or SPIEC-EASI [23] [9], or by applying transformations like the center-log ratio (CLR) [23].
- Sparsity and Zero-Inflation: Datasets contain many zeros due to true absence or undersampling. Prevalence filtering (e.g., retaining taxa present in >10-20% of samples) is commonly applied, though it risks excluding members of the rare biosphere [23].
- Sampling Heterogeneity: Varying sequencing depths between samples can introduce bias. Rarefaction is a common but debated normalization method; its effect depends on the downstream inference algorithm [23].
Detailed Protocol for Inferring and Validating Network Edges
Workflow for Microbial Network Inference
The following standardized protocol ensures robust and biologically interpretable network inference.
Protocol Steps
Stage 1: Data Preparation and Curation
Goal: Generate a clean, biologically relevant abundance table for network inference.
- Taxonomic Agglomeration: Cluster sequences into Operational Taxonomic Units (OTUs) at 97% similarity or resolve into Amplicon Sequence Variants (ASVs). Decide on the taxonomic level (e.g., genus, species) for node identity [23].
- Data Filtering: Apply a prevalence filter to reduce zero-inflation and spurious correlations. A common threshold is retaining taxa present in at least 10-20% of samples. The specific threshold represents a trade-off between inclusivity and accuracy [23].
- Data Normalization:
- For correlation-based methods (e.g., Pearson, Spearman), consider rarefaction to even sequencing depth, though be aware of potential precision loss [23].
- For compositional-data methods, apply a center-log ratio (CLR) transformation to the entire dataset or use tools like
SPIEC-EASIorSparCCthat internally handle compositionality [23] [9].
- Inter-Kingdom Data: When integrating data from different domains (e.g., bacteria and fungi), transform and normalize each dataset independently before concatenation to avoid introducing bias [23].
Stage 2: Network Construction and Edge Selection
Goal: Infer a robust, sparse microbial association network.
- Software and Method Selection: Choose an inference method appropriate for your data and question.
- Correlation-based: CoNet, SparCC. Good for initial, undirected networks [24] [25].
- Conditional Dependence-based: SPIEC-EASI, gCoda, SPRING. Better for discerning direct from indirect interactions [24] [9].
- Ensemble Methods: OneNet. Combines multiple methods to produce a consensus network, often with higher precision [24].
- Edge Selection and Stability:
Stage 3: Biological Interpretation and Validation
Goal: Translate the statistical network into biologically meaningful insights.
- Topological Analysis: Calculate network properties (connectivity, modularity) and identify keystone taxa—highly connected hubs that may exert a disproportionate influence on the community regardless of their abundance [25].
- Hypothesis Generation: Map edge signs (positive/negative) to potential ecological interactions (Table 1). For example, a dense cluster of positive edges might indicate a microbial guild—a group of taxa performing a coordinated function [24] [9].
- Experimental Validation:
- Targeted Culturing: Co-culture taxa connected by strong edges to test for predicted interactions [23].
- Metabolomic Profiling: Correlate microbial abundance with metabolite data to identify potential mechanisms (e.g., the production of a specific growth-inhibiting compound) [27].
- Perturbation Experiments: Introduce a defined perturbation (e.g., antibiotics, nutrient shift) and track whether the predicted changes in connected taxa occur [22].
The Scientist's Toolkit: Essential Reagents and Computational Solutions
Table 3: Key Research Reagents and Solutions for Network Analysis
| Item Name | Function/Biological Role | Application Context |
|---|---|---|
| 16S rRNA Gene Primers (e.g., 338F/806R) | Amplify hypervariable regions for bacterial community profiling via amplicon sequencing [28]. | Generating taxonomic abundance data from environmental samples (e.g., gut, soil). |
| DNA Extraction Kit (e.g., QIAamp DNA Stool Mini Kit) | Isolate high-quality microbial genomic DNA from complex sample matrices [28]. | Standardized DNA extraction for sequencing from stool or luminal contents. |
| Greengenes Database | Curated 16S rRNA gene database for taxonomic classification of sequence variants [28]. | Assigning taxonomic identities to OTUs/ASVs after sequencing. |
| SPIEC-EASI Software | Statistical tool for inferring microbial ecological networks from compositional data [24] [9]. | Inferring conditional dependence networks that help distinguish direct from indirect interactions. |
| OneNet R Package | Consensus network inference method combining multiple algorithms for robust edge prediction [24]. | Generating a unified, more reliable network from microbiome abundance data. |
| NetCoMi R Package | Comprehensive toolbox for network construction, comparison, and analysis of microbiome data [24]. | Full pipeline analysis, from pre-processing to statistical comparison of networks. |
Advanced Considerations and Multi-Omics Integration
Moving beyond taxon-taxon associations, edges can represent relationships between different types of biological entities in a multi-omics network [27]. For instance, in a bipartite network, edges can connect:
- Microbial taxa to host metabolites, suggesting potential microbial modulation of the host metabolome [27].
- Microbial genes to expressed transcripts, linking genetic potential with activity [26].
- Fungal taxa to bacterial taxa, revealing cross-domain ecological interactions [23].
Inferring edges in multi-omics contexts requires sophisticated integration methods, such as Similarity Network Fusion or Multi-Omics Factor Analysis, which can handle the heterogeneous and high-dimensional nature of the data [27]. Crucially, the interpretation of an edge must now span different biological layers, requiring deep domain expertise.
An edge in a microbiome network is a gateway to formulating hypotheses about microbial interactions, not a definitive observation of a biological mechanism. Its accurate interpretation is deeply entangled with the choices made during data generation, preprocessing, and statistical inference. By adhering to standardized protocols, acknowledging the limitations of inference methods, and prioritizing experimental validation, researchers can robustly leverage network analysis to unravel the complex web of microbial interactions. This disciplined approach is fundamental for translating network inferences into meaningful biological discoveries and, ultimately, into novel therapeutic strategies for managing microbiome-associated diseases.
From Data to Networks: A Guide to Methodologies and Workflows
The field of microbiome research has rapidly evolved from cataloging microbial compositions to understanding the complex web of interactions that govern community dynamics and host health. Inferring these microbial interaction networks from high-throughput sequencing data presents unique statistical challenges due to the compositional, sparse, and high-dimensional nature of microbiome datasets [22]. Network inference algorithms serve as essential tools for reconstructing these complex ecological relationships, enabling researchers to identify key microbial players, understand community stability, and identify potential therapeutic targets [29] [22]. Within this context, inference algorithms can be broadly categorized into three methodological frameworks: correlation-based approaches, regression-based methods, and graphical models, each with distinct theoretical foundations, applications, and limitations for microbiome interaction analysis.
Correlation-Based Approaches
Correlation-based methods represent the most straightforward approach for inferring microbial associations by measuring pairwise statistical dependencies between taxa abundance profiles across samples. These methods identify co-occurrence (positive correlation) or mutual exclusion (negative correlation) patterns that may indicate ecological interactions such as competition, mutualism, or commensalism [22]. The fundamental concept of correlation as a statistical measure of association between two variables provides the foundation for these methods, with Pearson's correlation coefficient (r) quantifying the strength and direction of linear relationships [30].
Key Algorithms and Methodological Considerations
Table 1: Correlation-Based Network Inference Algorithms
| Algorithm | Correlation Type | Key Features | Applicable Data Types |
|---|---|---|---|
| SparCC [29] | Pearson | Accounts for compositionality; uses log-ratio transformations | Compositional count data |
| MENAP [29] | Pearson/Spearman | Employs Random Matrix Theory to determine significance thresholds | Relative abundance data |
| CoNet [29] | Multiple | Integrates multiple correlation measures with ensemble methods | General microbiome data |
| Traditional Pearson/Spearman [22] | Pearson/Spearman | Standard implementation; may produce spurious results in compositional data | Non-compositional data |
Correlation methods face particular challenges with microbiome data due to its compositional nature (data summing to a constant, typically 1 or 100%), which can lead to spurious correlations [3] [22]. Methods like SparCC address this limitation by using log-ratio transformations of the relative abundance data, providing more robust correlation estimates for compositional datasets [29].
Experimental Protocol: Implementing SparCC for Microbial Correlation Networks
Purpose: To infer microbial co-occurrence networks from compositional microbiome data using SparCC.
Materials:
- Input Data: OTU or ASV count table (samples × taxa)
- Software: Python with SparCC implementation (available through GitHub repositories)
- Computing Environment: Standard computational workstation with ≥8GB RAM
Procedure:
- Data Preprocessing:
- Filter rare taxa with prevalence <10% across samples
- Apply additive log-ratio transformation to counts
- Optional: Address zeros using pseudocounts or multiplicative replacement
Parameter Configuration:
- Set number of iterations: 100 (default)
- Define variance threshold: 0.1 (typical for microbiome data)
- Specify number of bootstraps: 1000 for p-value calculation
Network Inference:
- Calculate correlations using iterative SparCC algorithm
- Generate p-values via bootstrap resampling
- Apply False Discovery Rate (FDR) correction (Benjamini-Hochberg, q<0.05)
Network Construction:
- Create adjacency matrix from significant correlations
- Define edges for |r| > 0.6 with q < 0.05
- Export network file for visualization (GML or GraphML format)
Interpretation: Positive correlations (r > 0) suggest potential cooperative relationships or shared environmental preferences, while negative correlations (r < 0) may indicate competitive exclusion or distinct niche preferences [22].
Regression-Based Methods
Regression-based approaches frame network inference as a variable selection problem, where the abundance of each taxon is predicted using the abundances of all other taxa in the community. These methods specifically aim to distinguish direct interactions from indirect associations by conditioning on other community members [29]. The core concept builds on simple linear regression principles, where a response variable (y) is modeled as a function of predictor variables (x), expressed as ŷ = b₀ + b₁x, with b₀ representing the y-intercept and b₁ the slope coefficient [30].
Key Algorithms and Regularization Approaches
Table 2: Regression-Based Network Inference Algorithms
| Algorithm | Regression Framework | Regularization Approach | Key Features |
|---|---|---|---|
| CCLasso [29] | Linear regression | LASSO (L1) | Uses log-ratio transformed data |
| REBACCA [29] | Linear regression | LASSO (L1) | Infers sparse microbial associations |
| SPIEC-EASI [29] | Linear regression | LASSO (L1) | Compositionally-aware framework |
| MAGMA [29] | Linear regression | LASSO (L1) | Infers sparse precision matrix |
| fuser [31] | Generalized linear model | Fused LASSO | Shares information across environments; preserves niche-specific signals |
| LUPINE [3] | PLS regression | Dimension reduction | Handles longitudinal data; uses PCA/PLS for low-dimensional approximation |
Regularization techniques, particularly LASSO (Least Absolute Shrinkage and Selection Operator), are central to many regression-based approaches for microbiome network inference. LASSO applies an L1 penalty that shrinks regression coefficients toward zero, effectively performing variable selection and producing sparse networks where only the strongest associations are retained [29]. The recently introduced fuser algorithm extends this concept by applying fused LASSO to retain subsample-specific signals while sharing information across environments, generating distinct predictive networks for different ecological niches [31].
Experimental Protocol: SPIEC-EASI for Sparse Microbial Network Inference
Purpose: To infer sparse microbial interaction networks using the SPIEC-EASI framework.
Materials:
- Input Data: Filtered OTU/ASV count table
- Software: R with SPIEC.EASI package
- Computing Environment: RStudio with ≥8GB RAM
Procedure:
- Data Preparation:
- Center-log ratio (CLR) transform count data
- Optional: Address zeros using Bayesian-multiplicative replacement
Model Selection:
- Choose neighborhood selection (MB) or graphical lasso (Glasso) approach
- Set stability selection threshold: 0.05 (recommended for microbiome data)
- Define number of lambda (penalty) parameters to test: 50
Model Fitting:
- Execute SPIEC-EASI with selected parameters
- Perform model selection via StARS (Stability Approach to Regularization Selection)
- Retain edges with stability >0.9
Network Refinement:
- Apply model checking for goodness-of-fit
- Calculate edge weights from precision matrix
- Export network file with edge weights and confidence scores
Interpretation: The resulting network represents conditional dependencies between taxa, where edges indicate direct associations after accounting for all other taxa in the community. The edge weights correspond to partial correlations derived from the precision matrix [29].
Graphical Models
Graphical models represent the most sophisticated approach to network inference, combining graph theory with probability theory to model complex dependency structures among microbial taxa [32]. These models represent variables as nodes in a graph and conditional dependencies as edges, providing a framework for representing both the structure and strength of microbial interactions [33] [34]. In Gaussian Graphical Models (GGMs), a specific type of graphical model, partial correlations are derived from the inverse of the covariance matrix (precision matrix), where a zero entry indicates conditional independence between two variables after accounting for all other variables in the model [35].
Key Algorithms and Mathematical Formulation
Table 3: Graphical Model-Based Network Inference Algorithms
| Algorithm | Model Type | Key Features | Data Requirements |
|---|---|---|---|
| gCoda [29] | GGM | Compositionally-aware GGM | Cross-sectional microbiome data |
| mLDM [29] | Latent Dirichlet Model | Bayesian approach with latent variables | Multinomial count data |
| MDiNE [29] | Bayesian GGM | Models microbial interactions in case-control studies | Case-control microbiome data |
| COZINE [29] | GGM | Compositional zero-inflated network estimation | Sparse microbiome data |
| HARMONIES [29] | GGM | Uses centered log-ratio transformation with priors | Compositional data |
| Cluster-based Bootstrap GGM [35] | GGM | Handles correlated data (e.g., longitudinal, family studies) | Clustered or longitudinal data |
For a random vector Y = (Y₁, Y₂, ..., Yₚ) following a multivariate normal distribution, the partial correlation between Yᵢ and Yⱼ given all other variables is defined as ρᵢⱼ = -kᵢⱼ/√(kᵢᵢkⱼⱼ), where kᵢⱼ represents the (i,j)th entry of the precision matrix K = Σ⁻¹ [35]. An edge exists between two variables in the graph if the partial correlation between them is significantly different from zero, indicating conditional dependence.
Experimental Protocol: Gaussian Graphical Models for Microbial Conditional Dependence Networks
Purpose: To infer microbial interaction networks using Gaussian Graphical Models that represent conditional dependence relationships.
Materials:
- Input Data: CLR-transformed abundance data
- Software: R with huge or mgm packages
- Computing Environment: Computational server with ≥16GB RAM for large datasets
Procedure:
- Data Transformation:
- Apply CLR transformation to count data
- Check multivariate normality assumptions
- Standardize variables to mean=0, variance=1
Precision Matrix Estimation:
- Select estimation method (graphical lasso, neighborhood selection)
- Set penalty parameter via cross-validation or information criteria
- Compute precision matrix with selected regularization
Significance Testing:
- Calculate partial correlations from precision matrix
- Perform Fisher's z-transformation: z = 0.5 × log((1+r)/(1-r))
- Test null hypothesis H₀: ρᵢⱼ = 0 using reference distribution N(0, 1/(n-p-3))
Network Construction:
- Retain edges with FDR-corrected p-value < 0.05
- Apply optional stability selection
- Validate network structure with bootstrap resampling (100 iterations)
Interpretation: In the resulting GGM, edges represent direct conditional dependencies between taxa after accounting for all other taxa in the model. The absence of an edge between two taxa indicates conditional independence, suggesting no direct ecological interaction [35] [34].
Comparative Analysis and Applications
Performance Considerations Across Data Types
The selection of an appropriate inference algorithm depends critically on study design, data characteristics, and research objectives. Correlation-based methods generally offer computational efficiency but may capture both direct and indirect associations, potentially leading to spurious edges [22]. Regression-based approaches, particularly those with regularization, better distinguish direct interactions but require careful parameter tuning [29] [31]. Graphical models provide the most rigorous framework for conditional dependence but have stronger distributional assumptions and computational demands [35] [34].
For longitudinal microbiome studies, specialized methods like LUPINE (LongitUdinal modelling with Partial least squares regression for NEtwork inference) leverage information from multiple time points to capture dynamic microbial interactions [3]. When analyzing data with inherent correlations, such as family-based studies or repeated measurements, the cluster-based bootstrap GGM approach controls Type I error inflation without sacrificing statistical power [35].
Validation Frameworks
Robust validation of inferred networks remains challenging in microbiome research due to the lack of ground truth networks. Cross-validation approaches, such as the Same-All Cross-validation (SAC) framework, provide a method for evaluating algorithm performance by testing predictive accuracy both within and across environmental niches [31]. External validation using experimental data or comparison with established microbial relationships further strengthens confidence in inferred networks [22].
Essential Research Reagents and Computational Tools
Table 4: Research Reagent Solutions for Microbiome Network Inference
| Resource Type | Specific Tools/Platforms | Function/Purpose |
|---|---|---|
| Data Processing | QIIME 2, DADA2, mothur | Processes raw sequencing data into OTU/ASV tables |
| Statistical Software | R, Python, MATLAB | Provides environment for statistical analysis and network inference |
| Specialized R Packages | SPIEC.EASI, huge, mgm, phyloseq | Implements specific network inference algorithms |
| Specialized Python Libraries | Scikit-learn, NumPy, SciPy | Provides general machine learning and statistical functions |
| Visualization Tools | Cytoscape, Gephi, R/ggraph | Enables network visualization and exploration |
| Validation Frameworks | SAC (Same-All Cross-validation) [31] | Evaluates algorithm performance across environments |
Workflow and Conceptual Diagrams
Microbiome Network Inference Workflow
Algorithm Taxonomy and Characteristics
Microbial communities are complex ecosystems where interactions between microorganisms play a crucial role in determining community structure and function across diverse environments, from the human gut to soil and aquatic systems [36] [37]. Understanding these complex interactions is essential for advancing knowledge in fields ranging from human health to ecosystem ecology. The emergence of high-throughput sequencing technologies has enabled researchers to profile microbial communities, generating vast amounts of taxonomic composition data [38] [39]. However, analyzing these data presents significant statistical challenges due to their unique characteristics, including compositional constraints, high dimensionality, and zero-inflation [37] [40].
Network inference approaches provide a powerful framework for identifying potential ecological relationships between microbial taxa from compositional data [41]. In these microbial co-occurrence networks, nodes represent taxonomic units, and edges represent significant associations—either positive (co-occurrence) or negative (mutual exclusion) [39]. However, standard correlation metrics applied directly to raw compositional data can produce spurious associations due to the inherent data constraints, necessitating specialized compositionally-robust methods [37] [42]. This application note focuses on three pivotal methods—SPIEC-EASI, SparCC, and CCLasso—that address these challenges through different statistical frameworks for accurate microbial network inference.
Methodological Foundations
The Compositionality Problem in Microbiome Data
Microbiome sequencing data are inherently compositional because the total number of sequences obtained per sample (sequencing depth) is arbitrary and varies between samples. Consequently, counts are typically normalized to relative abundances, where each taxon's abundance is expressed as a proportion of the total sample abundance [37] [40]. This normalization introduces a constant-sum constraint, meaning that an increase in one taxon's relative abundance necessitates a decrease in others, creating dependencies between taxa that are technical artifacts rather than biological relationships [37].
The mathematical representation of this problem can be expressed as follows: Let (W = (W1,\ldots,Wp)^{\mathrm{T}}) with (W_j>0) for all (j) be a vector of latent variables representing the absolute abundances of (p) taxa. The observed data are expressed as random variables corresponding to proportional abundances:
[ Xj = \frac{Wj}{\sum{k=1}^{p}Wk},\quad \text{ for all }\ j ]
The random vector (\boldsymbol{X}=(X1,\ldots, Xp)^{\mathrm{T}}) is a composition with non-negative components that are restricted to the simplex (\sum{k=1}^{p}Xk=1) [40]. This simplex constraint places a fundamental restriction on the degrees of freedom, making the components non-independent and complicating direct correlation analysis.
Several computational approaches have been developed to address the compositionality problem in microbiome data. SPIEC-EASI (SParse InversE Covariance Estimation for Ecological Association Inference) combines data transformations from compositional data analysis with a graphical model inference framework that assumes the underlying ecological association network is sparse [37] [42]. SparCC (Sparse Correlations for Compositional Data) uses an iterative approximation approach to estimate correlations between the underlying absolute abundances using log-ratio transformations of compositional data [36] [37]. CCLasso (Correlation inference for Compositional data through Lasso) employs a novel loss function inspired by the lasso penalized D-trace loss to obtain sparse estimates of the correlation structure [36] [40].
Table 1: Core Characteristics of Compositionally-Robust Network Inference Methods
| Method | Statistical Foundation | Association Type | Key Assumptions | Handling of Zeros |
|---|---|---|---|---|
| SPIEC-EASI | Graphical model (neighborhood selection/sparse inverse covariance) | Conditional dependence | Underlying network is sparse | Pseudo-count addition |
| SparCC | Iterative log-ratio correlation approximation | Marginal correlation | Networks are large-scale and sparse | Pseudo-count addition |
| CCLasso | Lasso-penalized D-trace loss | Correlation | Sparsity of correlations | Pseudo-count addition |
| COZINE | Multivariate Hurdle model with group-lasso | Conditional dependence | - | Explicit zero modeling |
Detailed Methodologies
SPIEC-EASI (SParse InversE Covariance Estimation for Ecological Association Inference)
SPIEC-EASI employs a two-step approach to network inference that first transforms compositional data and then applies sparse graphical model inference [37] [42]. The method begins with a centered log-ratio (clr) transformation applied to the observed compositional data. The clr transformation moves the data from the p-dimensional simplex to Euclidean space, making standard statistical analysis methods valid. The transformation is defined as:
[ \text{clr}(Xj) = \log\left(\frac{Xj}{g(\boldsymbol{X})}\right) ]
where (g(\boldsymbol{X})) is the geometric mean of the composition (\boldsymbol{X}) [43].
For the network inference step, SPIEC-EASI provides two alternative approaches: neighborhood selection (based on the Meinshausen-Bühlmann method) and sparse inverse covariance estimation (graphical lasso) [37]. Both approaches rely on the concept of conditional independence to distinguish direct from indirect associations. In this framework, two nodes (OTUs) are conditionally independent if, given the abundances of all other nodes in the network, neither provides additional information about the abundance of the other [37] [42]. A link between any two nodes in the graphical model implies that the OTU abundances are not conditionally independent and that there is a linear relationship between them that cannot be better explained by an alternate network wiring.
SPIEC-EASI uses the StARS (Stability Approach to Regularization Selection) method to select the sparsity parameter, which provides a sparse and stable network [43]. The method assumes that the underlying ecological association network is sparse, meaning that each taxon interacts with only a limited number of other taxa—a reasonable assumption for large microbial systems.
Figure 1: SPIEC-EASI workflow for microbial network inference
SparCC (Sparse Correlations for Compositional Data)
SparCC employs an iterative approach to approximate the correlations between the underlying absolute abundances of taxa based on compositional data [36] [37]. The method is based on the relationship between the covariance of the log-transformed absolute abundances ((Ti = \log(Wi))) and the variances and covariances of the log-ratio transformed compositional data.
The foundational insight of SparCC is that for a composition (\boldsymbol{X} = (X1, X2, ..., Xp)), the variance of the log-ratio between two components (Xi) and (X_j) can be expressed as:
[ \text{Var}\left(\log\frac{Xi}{Xj}\right) = \text{Var}(Ti - Tj) = \text{Var}(Ti) + \text{Var}(Tj) - 2\text{Cov}(Ti, Tj) ]
where (Ti = \log(Wi)) represents the log-transformed absolute abundances [37].
SparCC's algorithm follows these key steps:
- Estimation of basis variances: Initially assumes all taxa are uncorrelated to estimate variances of (T_i) from the observed log-ratio variances.
- Correlation estimation: Uses the estimated variances to compute covariances and correlations between taxa.
- Iterative refinement: Identifies the strongest correlated pair, excludes it, and re-estimates variances and correlations under the assumption that the strongest correlation is likely genuine.
- Thresholding: Applies a correlation threshold to obtain a sparse network.
SparCC assumes that the underlying ecological network is large-scale and sparse—meaning most taxa do not strongly interact with most others—which is generally reasonable for diverse microbial communities [36] [37].
CCLasso (Correlation Inference for Compositional Data through Lasso)
CCLasso takes a different approach by formulating the correlation estimation problem through a lasso-penalized D-trace loss function [36] [40]. The method directly models the covariance matrix of the log-transformed absolute abundances (\boldsymbol{T} = (T1, T2, ..., T_p)) and uses a convex optimization approach to obtain a sparse correlation matrix.
The CCLasso method minimizes the following objective function:
[ L(\Omega) = \frac{1}{2}\text{tr}(\Omega \Sigma \Omega) - \text{tr}(\Omega) + \lambda \|\Omega\|_1 ]
where (\Sigma) is the sample covariance matrix of the log-ratio transformed data, (\Omega) is the precision matrix (inverse covariance matrix) to be estimated, and (\lambda) is the tuning parameter that controls the sparsity level [36]. The (\|\Omega\|_1) term represents the L1-norm penalty that encourages sparsity in the estimated precision matrix.
Unlike SparCC, CCLasso considers a loss function that specifically accounts for the compositional nature of the data while using L1-norm shrinkage to obtain a sparse correlation matrix. The method is computationally efficient compared to earlier approaches like SparCC and provides theoretical guarantees on the estimation consistency [36] [40].
Table 2: Comparative Analysis of Methodological Approaches
| Aspect | SPIEC-EASI | SparCC | CCLasso |
|---|---|---|---|
| Core Approach | Graphical model inference | Iterative approximation | Penalized loss minimization |
| Association Type | Conditional dependence | Marginal correlation | Correlation |
| Theoretical Basis | Conditional independence | Log-ratio variance decomposition | D-trace loss with L1 penalty |
| Sparsity Control | StARS stability selection | Iterative exclusion & thresholding | L1 regularization |
| Computational Complexity | Moderate | Low to Moderate | Moderate |
| Key Innovation | Combining clr transformation with graphical models | Using log-ratio variances to estimate correlations | Compositionally-aware penalized optimization |
Experimental Protocols
Standardized Workflow for Microbial Network Inference
A typical workflow for estimating microbial association networks involves several critical steps, from data preprocessing to network analysis. The following protocol outlines a standardized pipeline applicable across methods with method-specific adaptations noted where appropriate [43].
Step 1: Data Preprocessing
- Perform taxonomic aggregation (typically to genus level)
- Apply prevalence filtering (e.g., retain taxa present in >20% of samples)
- Add relative abundance assay
- Apply appropriate data transformations:
- For SPIEC-EASI: Centered log-ratio (clr) transformation
- For SparCC: Log-transformation of relative abundances
- For CCLasso: Log-ratio transformation
Step 2: Association Estimation
- SPIEC-EASI: Apply either neighborhood selection (MB) or sparse inverse covariance selection (GLASSO) to clr-transformed data
- SparCC: Implement iterative approximation of correlations from log-ratio variances
- CCLasso: Optimize the lasso-penalized D-trace loss function
Step 3: Sparsification
- Apply appropriate sparsification techniques to eliminate weak associations:
- SPIEC-EASI: Uses StARS stability selection with recommended threshold of 0.05
- SparCC: Typically uses arbitrary threshold on correlation magnitude
- CCLasso: Uses L1 regularization parameter selected through cross-validation
Step 4: Network Analysis
- Transform associations into dissimilarities ("signed" or "unsigned" transformation)
- Convert dissimilarities to similarities/edge weights
- Calculate network properties (centrality, connectivity, modularity)
- Visualize the resulting network
Implementation in R
Each method has associated R packages that facilitate implementation:
SPIEC-EASI Implementation:
SparCC Implementation:
CCLasso Implementation:
The Scientist's Toolkit
Table 3: Essential Research Reagents and Computational Tools for Microbial Network Inference
| Category | Item/Software | Specification/Function | Application Notes |
|---|---|---|---|
| Data Processing | mia R package | Data container and preprocessing | Taxonomic tree manipulation and data aggregation |
| zCompositions R package | Zero replacement methods | Handles sparse count data | |
| propr R package | Proportionality analysis | Alternative to correlation for compositional data | |
| Network Inference | SpiecEasi R package | Implements SPIEC-EASI and SparCC | Primary tool for network inference |
| CCLasso R package | Implementation of CCLasso method | Efficient correlation estimation | |
| Spring R package | Implements SPRING method | Semi-parametric rank-based approach | |
| Network Analysis | igraph R package | Network analysis and visualization | Centrality, modularity, network properties |
| NetCoMi R package | Comprehensive network analysis | Comparison between networks | |
| Gephi software | Network visualization | Alternative to R for large network visualization | |
| Validation | mina R package | Microbial community diversity and network analysis | Statistical comparison of networks |
| HARMONIES R package | Bayesian network inference | Hybrid approach for microbiome data |
Performance Considerations and Method Selection
Comparative Performance Across Network Types
Evaluations of compositionally-robust methods have revealed important performance patterns across different ecological scenarios. A comprehensive assessment using generalized Lotka-Volterra models to simulate microbial population dynamics found that method performance depends significantly on network structure and interaction types [36].
The study demonstrated that co-occurrence network methods perform better in competitive communities compared to those with predator-prey (parasitic) relationships [36]. Additionally, performance was generally better for random networks compared to more complex scale-free networks with heterogeneous degree distributions [36]. Contrary to expectations, later compositionally-aware methods sometimes performed equally or less effectively than classical methods like Pearson's correlation, highlighting the importance of method selection based on ecological context [36].
Handling of Method-Specific Challenges
Each method addresses specific challenges in microbiome data analysis:
Zero-Inflation: Microbiome data typically contain a large proportion of zeros due to both biological absence and technical limitations [40]. Most methods, including SPIEC-EASI, SparCC, and CCLasso, employ pseudo-count addition (typically 0.5 or 1) to handle zeros, though this approach has limitations [40]. Novel methods like COZINE (Compositional Zero-Inflated Network Estimation) explicitly model zero-inflation using multivariate Hurdle models, providing potentially more accurate representation of microbial relationships [40].
High-Dimensionality: Microbial datasets typically have far more taxa (p) than samples (n), creating underdetermined estimation problems. All three methods incorporate sparsity assumptions to address this challenge, though through different mechanisms: SPIEC-EASI via graphical model sparsity, SparCC through iterative exclusion of strong correlations, and CCLasso via L1 regularization [36] [37] [40].
Compositional Effects: Each method employs distinct mathematical transformations to address compositional constraints: SPIEC-EASI uses clr transformation, SparCC uses log-ratio variance decomposition, and CCLasso employs a specialized loss function that accounts for compositionality [43] [36] [37].
Figure 2: Key challenges in microbiome network inference and methodological solutions
Advanced Applications and Emerging Directions
Longitudinal Network Analysis
Traditional network inference methods assume static interactions, but microbial communities are dynamic systems. The LUPINE (LongitUdinal modelling with Partial least squares regression for NEtwork inference) method represents an advancement for longitudinal microbiome studies, enabling inference of microbial networks that evolve over time [3]. LUPINE uses partial least squares regression to incorporate information from previous time points when estimating current networks, capturing the temporal dynamics of microbial interactions [3].
Network Comparison and Differential Analysis
Comparing networks across different conditions (e.g., healthy vs. diseased) requires specialized statistical approaches. The mina R package provides a computational framework for comparing microbial networks across conditions using permutation-based statistical tests [41]. This approach enables researchers to identify condition-specific interactions and determine whether observed network differences are statistically significant [41].
Validation Frameworks
A critical challenge in microbial network inference is the lack of gold-standard validation datasets. A novel cross-validation method has been proposed to evaluate co-occurrence network inference algorithms, providing robust estimates of network stability and enabling hyper-parameter selection [39]. This approach addresses the limitations of previous evaluation criteria that relied on external data validation or network consistency across sub-samples [39].
SPIEC-EASI, SparCC, and CCLasso represent significant advancements in compositionally-robust inference of microbial ecological networks. Each method offers distinct advantages: SPIEC-EASI excels in identifying conditionally independent associations through graphical models, SparCC provides an intuitive correlation-based approximation, and CCLasso offers computational efficiency through convex optimization. Method selection should be guided by specific research questions, data characteristics, and ecological context, as performance varies across network structures and interaction types.
Emerging methods that address longitudinal dynamics, explicit zero-inflation modeling, and robust statistical comparison between networks represent the next frontier in microbial network inference. As the field progresses, integration of these compositionally-robust methods with complementary approaches for validation and comparison will further enhance our ability to infer meaningful ecological relationships from microbiome data.
The human gut microbiota is a complex ecosystem of trillions of microorganisms that play critical roles in host physiology, including digestion, immune function, and metabolism [10]. Understanding the intricate interactions within these microbial communities—through mutualism, competition, commensalism, and parasitism—is essential for unraveling their ecological dynamics and impact on human health [10] [44]. Network-based approaches have emerged as powerful tools for inferring these microbial interactions and identifying microbial guilds: groups of microorganisms that co-occur and potentially interact functionally [10].
Microbial interaction networks represent taxa as nodes and their inferred interactions as edges. While early methods relied heavily on correlation analyses, these approaches capture total dependencies and are confounded by environmental factors, failing to reliably distinguish indirect from direct effects [10]. Conditional dependence-based methods, particularly Gaussian Graphical Models (GGM), have gained prominence as they eliminate spurious correlations and yield sparser, more biologically interpretable networks [10]. The challenging characteristics of microbiome data—including compositionality, sparsity, heterogeneity, and high dimensionality—complicate network inference and have led to a proliferation of methods that often generate conflicting results when applied to the same dataset [10] [44]. This methodological diversity underscores the critical need for robust consensus approaches that can integrate multiple inference strategies to produce more reliable networks.
The OneNet Framework: Rationale and Architecture
OneNet addresses the challenge of methodological inconsistency through a consensus network inference approach that combines seven established methods based on stability selection [10]. This ensemble strategy leverages the strengths of multiple inference techniques while mitigating individual limitations. The framework incorporates these seven GGM-based methods: Magma, SpiecEasi, gCoda, PLNnetwork, EMtree, SPRING, and ZiLN [10]. These methods were selected based on their statistical grounding and computational efficiency, while excluded methods either generated inferior performance in preliminary tests or could not be integrated due to implementation constraints [10].
The fundamental innovation of OneNet lies in its modification of the stability selection framework to use edge selection frequencies directly, ensuring only reproducible edges are included in the final consensus network [10]. This approach transforms the network inference problem from identifying a single optimal model to aggregating evidence across multiple robust methods, prioritizing edges that consistently appear across methods and resampling iterations.
Table 1: Network Inference Methods Integrated in OneNet
| Method | Normalization | Distribution | Inference Approach | Covariates |
|---|---|---|---|---|
| SpiecEasi | CLR | Multivariate Gaussian | Meinshausen-Bühlmann (MB) | No |
| gCoda | CLR | Multivariate Gaussian | glasso | No |
| SPRING | CLR | Copulas | MB | No |
| Magma | GMPR + RLE | Copulas + ZINB | MB | Yes |
| PLNnetwork | GMPR + RLE | PLN + Latent Variables | glasso | Yes |
| EMtree | GMPR + RLE | Latent Variables | Tree Averaging | Yes |
| ZiLN | CLR | Latent Variables | MB | No |
Abbreviations: CLR (Centered Log Ratio), GMPR (Geometric Mean of Pairwise Ratios), RLE (Relative Log Expression), ZINB (Zero-Inflated Negative Binomial), PLN (Poisson Lognormal), MB (Meinshausen-Bühlmann), glasso (graphical lasso)
Computational Protocols
OneNet Implementation Workflow
The OneNet framework follows a structured three-step procedure for robust consensus network reconstruction from microbial abundance data [10]:
Step 1: Data Preprocessing and Method Application
- Input: Taxon abundance matrix (samples × taxa) at any taxonomic rank
- Apply each of the seven inference methods to the complete dataset
- For each method, compute edge scores: either probabilities or maximum penalty levels (λ) for edge selection
Step 2: Stability Selection via Subsampling
- Perform B subsamples of the abundance matrix by selecting subsets of rows (samples)
- Recommended subsample size: n' = 0.8n if n ≤ 144, otherwise n' = 10√n [10]
- For each subsample b ∈ {1, ..., B} and each penalty parameter λk in grid {λ1, ..., λK}:
- Infer network Gb,k using each of the seven methods
- Compute selection frequency for each edge e and parameter λk:
- fek = (1/B) × Σb=1 to B 1{e ∈ Gb,k}
- where 1{·} is the indicator function
Step 3: Consensus Network Construction
- Combine edge selection frequencies across all seven methods
- Apply consensus threshold to select only highly reproducible edges
- Construct final network containing edges that consistently appear across methods and subsamples
Research Reagent Solutions
Table 2: Essential Computational Tools for Microbial Network Inference
| Tool/Resource | Function | Implementation in OneNet |
|---|---|---|
| Stability Selection | Assesses edge reproducibility across subsamples | Core framework modified to combine frequencies across methods |
| Gaussian Graphical Models (GGM) | Estimates conditional dependencies between taxa | Foundation for all seven constituent methods |
| R Statistical Environment | Platform for computational implementation | Required for executing OneNet and component methods |
| CLR/GMPR Normalization | Addresses compositionality of microbiome data | Used by various constituent methods for data transformation |
| Graphical Lasso (glasso) | Sparse inverse covariance estimation | Inference approach for gCoda and PLNnetwork |
| Meinshausen-Bühlmann (MB) | Neighborhood selection for sparse graphs | Inference approach for SpiecEasi, SPRING, Magma, and ZiLN |
Performance Benchmarking
Evaluation on Synthetic Data
Comprehensive validation on synthetic data demonstrates that OneNet achieves substantially higher precision compared to any individual method while producing slightly sparser networks [10]. This performance advantage stems from the consensus approach, which effectively filters out false positive edges that might appear in single-method networks while retaining robust, reproducible interactions.
The stability selection framework underlying OneNet provides a principled approach to regularization parameter selection by identifying the value that yields the most stable graph across subsamples [10]. The network stability measure is calculated as:
Sk = 1 - (4/q) × Σe fek(1 - fek)
where q represents the total number of possible edges, and fek represents the selection frequency of edge e for parameter λk [10].
Table 3: Performance Comparison of Network Inference Methods
| Method | Precision | Recall | Sparsity | Reproducibility |
|---|---|---|---|---|
| OneNet (Consensus) | Highest | Moderate | Slightly sparser | Highest |
| Individual Methods | Variable | Variable | Variable | Lower |
| Correlation-based | Lowest | Highest | Least sparse | Lowest |
Biological Validation in Cirrhosis Microbiome
Application of OneNet to gut microbiome data from liver cirrhosis patients successfully identified a cirrhotic cluster—a microbial guild composed of bacteria associated with degraded host clinical status [10]. This biologically meaningful demonstration confirms that the consensus network captures ecologically and clinically relevant interactions, potentially offering insights into the role of gut microbiota in disease progression.
The identified cluster exhibited coherent functional potential, suggesting that OneNet can reveal not just structural associations but also functional relationships within microbial communities. This capacity to identify clinically relevant microbial guilds makes OneNet particularly valuable for generating hypotheses about microbial contributions to health and disease.
Advanced Applications and Protocol Integration
Integration with Longitudinal Analysis
While OneNet focuses on cross-sectional data, longitudinal microbiome studies are increasingly valuable for capturing microbial dynamics [12]. The LUPINE (LongitUdinal modelling with Partial least squares regression for NEtwork inference) methodology represents a complementary approach designed specifically for longitudinal data, leveraging conditional independence and low-dimensional data representation to infer microbial networks across time points [12].
Researchers can adopt a hybrid analytical strategy:
- Apply OneNet to establish robust baseline interaction networks
- Use longitudinal methods like LUPINE to track temporal variations
- Integrate findings to distinguish stable microbial associations from transient dynamics
Multi-Omics Network Integration
The consensus principle underlying OneNet can be extended to multi-omics integration, addressing the growing complexity of microbiome studies that incorporate metabolomic, proteomic, and transcriptomic data [44]. Future methodological developments may include:
- Cross-omics consensus networks linking microbial taxa with metabolic functions
- Condition-specific consensus networks that adapt to different host states
- Dynamic consensus networks that capture ecological succession patterns
Experimental Design Considerations
For researchers applying OneNet, several experimental design factors require careful consideration:
- Sample Size: Adequate sample size (typically n > 50) is crucial for reliable network inference
- Data Preprocessing: Consistent normalization across methods is essential for valid consensus
- Computational Resources: Parallel computing is recommended for efficient implementation of multiple methods
- Validation Strategies: Independent validation through cultivation experiments or perturbation studies strengthens biological interpretations
The OneNet framework represents a significant advancement in microbial network inference by transforming methodological diversity from a challenge into an asset. By leveraging the collective strength of multiple inference approaches, OneNet provides researchers with a more robust, reproducible, and biologically insightful tool for deciphering the complex relationships within microbial ecosystems and their implications for human health and disease.
Microbial network inference is a critical methodology for deciphering the complex interplay within microbial communities, transforming abundance data into meaningful ecological interactions. In microbiome research, networks serve as temporal or spatial snapshots of ecosystems, where nodes represent microbial taxa and edges represent significant associations between them [3]. The standard workflow for constructing these networks must carefully address the inherent characteristics of microbiome data, including its compositional nature (where data represents relative proportions rather than absolute abundances), sparsity (with many zero counts), and high dimensionality (often more taxa than samples) [3] [43]. This protocol details the three fundamental stages of microbiome network analysis—data transformation, association estimation, and sparsification—providing researchers with a structured framework to infer robust and biologically meaningful microbial interactions.
The standard workflow for microbial network inference follows a sequential pipeline designed to address specific statistical challenges posed by microbiome data. Figure 1 illustrates the complete pathway from raw data to an interpretable network.
Figure 1. Standard Workflow for Microbiome Network Inference. The process begins with data transformation to address compositionality and sparsity, proceeds to association estimation to measure relationships between taxa, and concludes with sparsification to produce an interpretable network.
The initial data transformation phase is crucial because microbiome sequencing data is compositional—the absolute abundance of organisms is unknown, and we only observe relative proportions. Analyzing compositional data without proper transformation can lead to spurious correlations [3] [43]. Association estimation methods must therefore be compositionally aware, with partial correlation and proportionality measures being particularly valuable as they can distinguish between direct and indirect associations [3] [43]. Finally, sparsification addresses the high-dimensional nature of microbiome data (where the number of taxa p often exceeds the number of samples n) by filtering out weak associations likely to represent statistical noise, thus producing a biologically interpretable network [43].
Data Transformation Methods
Zero Replacement and Normalization Techniques
The data transformation phase prepares raw count data for robust association analysis by addressing sparsity and compositionality. Table 1 summarizes the key methods and their applications at this stage.
Table 1: Data Transformation Methods for Microbiome Network Inference
| Step | Method | Description | Considerations |
|---|---|---|---|
| Zero Replacement | Pseudo-count | Adding a small value (e.g., 1) to all counts | Simple but may introduce bias [43] |
| zCompositions R package | Advanced model-based imputation | More sophisticated handling of zeros [43] | |
| Normalization | Centered Log-Ratio (CLR) | Log-transforms relative abundances | Moves data to Euclidean space [43] |
| Variance Stabilizing Transformation (VST) | Stabilizes variance across abundance ranges | Suitable for count-based methods [43] | |
| Modified CLR (mCLR) | Calculates geometric mean only on non-zero values | Handles zeros without replacement (used in SPRING) [43] |
Zero replacement is necessary because subsequent statistical analyses typically require non-zero values. While a simple pseudo-count addition is computationally straightforward, more advanced approaches implemented in packages like zCompositions may provide more statistically rigorous solutions [43]. For normalization, the Centered Log-Ratio (CLR) transformation is particularly widely used as it effectively moves compositional data from a constrained simplex space to standard Euclidean space, making standard statistical tools valid. The CLR transformation is defined as:
[ \text{CLR}(x) = \left[\ln\frac{x1}{g(\mathbf{x})}, \ln\frac{x2}{g(\mathbf{x})}, \dots, \ln\frac{x_p}{g(\mathbf{x})}\right] ]
where (x_i) represents the abundance of taxon (i), and (g(\mathbf{x})) is the geometric mean of all taxa abundances in a sample [43]. Some methods like SPRING use a modified CLR (mCLR) approach that calculates the geometric mean using only non-zero values, making it particularly robust for sparse microbiome data [43].
Association Estimation
Compositionally-Aware Association Measures
Association estimation represents the core analytical phase where relationships between microbial taxa are quantified. Choosing an appropriate association measure is critical, as different methods capture distinct types of ecological relationships. Table 2 compares the main classes of compositionally-aware association measures used in microbiome research.
Table 2: Compositionally-Aware Association Measures for Microbiome Data
| Method Type | Specific Methods | Association Measured | Key Features |
|---|---|---|---|
| Correlation | SparCC, CCREPE, CCLasso | Unconditional association | Direct implementation for compositional data [43] |
| Partial Correlation | SPRING, SpiecEasi | Conditional dependence (direct association) | Controls for confounding effects of other taxa [3] [43] |
| Proportionality | Proportionality measures | Relative abundance relationships | Specifically designed for compositional data [43] |
Partial correlation methods, which estimate conditional dependencies, are particularly valuable for identifying putative direct ecological interactions because they measure the association between two taxa while controlling for the effects of all other taxa in the community [3]. This approach helps distinguish direct interactions from indirect connections mediated through other community members. The mathematical foundation involves estimating the association between taxa (i) and (j) conditional on all other taxa (-(i,j)):
[ \rho_{ij|-(i,j)} = \text{correlation}(X^i, X^j | X^{-(i,j)}) ]
where (X^i) and (X^j) represent the abundances of taxa (i) and (j), and (X^{-(i,j)}) represents the abundances of all other taxa [3].
For longitudinal studies with multiple time points, methods like LUPINE (LongitUdinal modelling with Partial least squares regression for NEtwork inference) extend this concept by incorporating information from previous time points when estimating networks at later time points, using techniques like PLS regression to maximize covariance between current and past microbial abundances [3].
Experimental Protocol: Association Estimation with SPRING
Protocol Title: Estimating Microbial Associations Using SPRING for Conditional Dependency Networks
Background: The SPRING (Semi-Parametric Rank-based approach for INference in Graphical model) method estimates sparse microbial networks based on conditional dependencies using a compositionally-aware approach [43].
Materials:
- R statistical environment (version 4.0 or higher)
- SPRING R package (available on GitHub)
- Microbiome abundance data (count matrix with samples as columns and taxa as rows)
Procedure:
- Data Preparation: Begin with a taxa abundance count matrix. No prior zero replacement or normalization is needed, as SPRING incorporates a modified CLR transformation that handles zeros intrinsically [43].
- Parameter Configuration: Set the
Rmethodargument to "approx" for computational efficiency. This uses a hybrid multi-linear interpolation approach to estimate correlations with controlled approximation error [43]. - Sparsification Selection: Utilize the StARS (Stability Approach to Regularization Selection) method with the threshold set to 0.05 to obtain a sparse association matrix. StARS selects the sparsification level based on edge stability across subsampled datasets [43].
- Execution: Run the SPRING algorithm on the transposed count matrix:
- Extract Results: Identify the optimal lambda index selected by StARS and extract the partial correlation matrix: Expected Output: A sparse partial correlation matrix representing the conditional dependency network between microbial taxa.
Troubleshooting: If computational time is excessive with large datasets, ensure Rmethod="approx" is specified. For overly dense networks, consider increasing the StARS threshold to 0.1 for greater sparsification.
Sparsification and Network Construction
Sparsification Techniques and Similarity Transformation
Sparsification transforms a complete association matrix into a sparse network by retaining only the most significant associations. This step is essential because directly converting all estimated associations into edges would produce an overly dense network where all nodes are connected, making biological interpretation challenging [43]. Figure 2 illustrates the primary sparsification approaches and their relationship to downstream network construction.
Figure 2. Sparsification and Network Construction Pathway. Multiple sparsification methods can be applied to obtain a sparse association matrix, which is then transformed through dissimilarity and similarity calculations to produce the final adjacency matrix for network analysis.
The most common sparsification approaches include:
- Thresholding: Associations with magnitudes below a specified threshold are set to zero [43]
- Statistical Testing: Student's t-test or permutation tests with the null hypothesis that the association is zero [43]
- Stability Selection: Methods like StARS (Stability Approach to Regularization Selection) used by SPRING and SpiecEasi, which select sparsification levels based on edge stability across data subsamples [43]
Following sparsification, the remaining associations are transformed into dissimilarities and then into similarities that serve as edge weights in the final network. The two primary transformations are:
- Signed: (d{ij} = \sqrt{0.5(1-r^*{ij})}), where strong negative associations have the largest distance [43]
- Unsigned: (d{ij} = \sqrt{1-{r{ij}^*}^2}), where both strong positive and negative associations have small distances [43]
The final similarity (edge weight) is calculated as (s{ij} = 1 - d{ij}), producing the adjacency matrix for network analysis [43].
Table 3: Research Reagent Solutions for Microbiome Network Inference
| Resource Type | Name | Specific Function | Application Context |
|---|---|---|---|
| R Packages | SPRING |
Estimates conditional dependency networks | General microbiome network inference [43] |
SpiecEasi |
Infers microbial networks via sparse inverse covariance | Cross-sectional microbiome studies [3] | |
NetCoMi |
Comprehensive network construction and analysis | Comparative network analysis [43] | |
zCompositions |
Handles zero replacement in count data | Data preprocessing [43] | |
| Methods | LUPINE |
Longitudinal network inference | Multi-timepoint study designs [3] |
LUPINE_single |
Single time point network inference | Cross-sectional analyses [3] | |
| Data Resources | mia R package |
Provides microbiome data structures and functions | Data handling and preprocessing [43] |
This toolkit provides the essential computational resources for implementing the standard workflow described in this protocol. The R packages listed offer specialized implementations of the statistical methods for each phase of network inference, from data preprocessing to network estimation and comparison. Researchers should select methods based on their study design—for instance, choosing LUPINE for longitudinal studies that track microbial communities over time [3], or SPRING and SpiecEasi for cross-sectional analyses that examine communities at a single time point [3] [43].
Method Selection Guidelines and Concluding Remarks
Selecting appropriate methods throughout the standard workflow requires careful consideration of study objectives and data characteristics. For association estimation, correlation-based methods like SparCC are computationally efficient but may detect both direct and indirect associations. Partial correlation methods like SPRING and SpiecEasi are preferable for identifying direct interactions but are more computationally intensive. For longitudinal studies, LUPINE provides the unique advantage of sequentially incorporating information from previous time points, enabling capture of dynamic microbial interactions that evolve over time [3].
Recent methodological advances have highlighted the importance of accounting for intra-species variation and dynamic interactions in microbiome networks. Methods like Dynamic Covariance Mapping (DCM) can quantify both inter- and intra-species interactions from abundance time-series data, revealing how ecological and evolutionary dynamics jointly shape microbiome structure [45]. Additionally, studies have shown that network properties can be sensitive to abundance variations, requiring careful interpretation of results, particularly in clinical contexts like inflammatory bowel disease where dysbiotic states may exhibit distinct network stability patterns [46].
When executing these protocols, researchers should maintain consistency in method application throughout the workflow, document all parameter settings and software versions for reproducibility, and validate findings through complementary analytical approaches where possible. By adhering to this standardized workflow and selecting methods appropriate for their specific research questions, scientists can generate robust, biologically informative microbial networks that advance our understanding of microbiome structure, dynamics, and function in health and disease.
The human gut microbiome, a complex ecosystem of trillions of microorganisms, plays a critical role in host physiology through digestion, immune function, and metabolism [24] [10]. Understanding the intricate interactions within this ecosystem is a major challenge in microbial ecology. Microbial network inference has emerged as a powerful computational approach to model these interactions as sparse and reproducible networks, revealing potential relationships between microbial taxa that co-occur and may interact [24]. These networks consist of nodes representing microbial species and edges representing interactions between them, supporting the identification of microbial guilds—groups of microorganisms that co-occur and potentially interact within the ecosystem [24].
In the context of liver cirrhosis, the gut microbiome undergoes significant dysbiosis, characterized by marked alterations in microbial composition and function [47]. The gut-liver axis serves as a crucial bidirectional communication pathway, where gut-derived metabolites and bacterial products can directly influence liver health [48] [47]. Network inference approaches applied to microbiome data from cirrhotic patients can identify disease-relevant microbial guilds, providing insights into the ecological dynamics of the gut microbiota and generating hypotheses about their role in disease progression [24]. This application note details how consensus network inference methods, specifically OneNet, can be applied to identify microbial guilds in liver cirrhosis, with implications for understanding disease mechanisms and developing targeted interventions.
Quantitative Microbial Signatures in Liver Cirrhosis
Meta-analyses of gut microbiome studies in liver cirrhosis reveal consistent taxonomic shifts that can serve as quantitative benchmarks for network inference studies.
Table 1: Core Gut Microbiota Alterations in Liver Cirrhosis from Meta-Analysis
| Taxonomic Level | Increased in Cirrhosis | Decreased in Cirrhosis |
|---|---|---|
| Phylum | Proteobacteria [49] | Firmicutes [47] [49] |
| Class | Bacilli [49] | Clostridia [49] |
| Family | Enterobacteriaceae, Pasteurellaceae, Streptococcaceae [49] | Lachnospiraceae, Ruminococcaceae [47] [49] |
| Genus | Haemophilus, Streptococcus, Veillonella [49], Enterococcus [50] | Roseburia, Faecalibacterium [50] |
Table 2: Functional and Diversity Metrics in Cirrhosis
| Parameter | Change in Cirrhosis | Notes |
|---|---|---|
| Alpha Diversity | Significantly reduced [49] | Includes Shannon, Chao1, observed species, ACE, and PD indices [49] |
| Beta Diversity | Significantly altered [49] | Over 80% of studies report significant differences [49] |
| SCFA Production | Markedly reduced [51] [47] | Fecal butyrate levels decrease by 40-70% [47] |
| Cirrhosis Dysbiosis Ratio (CDR) | Reduced [49] | (Ruminococcaceae + Lachnospiraceae + Veillonellaceae + Clostridiales Cluster XIV) / (Bacteroidaceae + Enterobacteriaceae) |
These conserved microbial signatures provide a foundation for validating networks inferred from cirrhotic patient data. The consistent depletion of short-chain fatty acid (SCFA)-producing families (Lachnospiraceae and Ruminococcaceae) and expansion of potential pathobionts (Enterobacteriaceae and Streptococcaceae) represent key targets for guild identification [47] [49].
Protocol: OneNet Consensus Network Inference for Guild Identification
OneNet is a consensus network inference method that combines seven established algorithms to generate robust microbial association networks [24] [10]. Below is a detailed protocol for applying OneNet to identify microbial guilds in liver cirrhosis.
The following diagram illustrates the complete OneNet workflow for inferring microbial guilds in liver cirrhosis:
Step-by-Step Protocol
Sample Preparation and Data Generation
- Patient Recruitment: Recruit cirrhotic patients and matched healthy controls following ethical approval and informed consent [51]. Exclusion criteria should include antibiotic use within 6 weeks, other gastrointestinal diseases, and use of probiotics/prebiotics [51] [49].
- Sample Collection: Collect fecal samples using standardized protocols, flash-freeze in liquid nitrogen, and store at -80°C until DNA extraction [51].
- Sequencing: Perform 16S rRNA gene amplicon sequencing (V4 region) or shotgun metagenomic sequencing on all samples [52] [49]. A minimum read depth of 10,000 reads per sample is recommended for robust analysis [52].
Data Preprocessing
- Quality Control: Process raw sequences through standardized pipelines (QIIME2 for 16S data) with denoising (DADA2), chimera removal, and truncation based on quality profiles [52].
- Taxonomic Assignment: Use pre-trained classifiers (Greengenes or SILVA databases for 16S data) with a 99% similarity threshold [52].
- Feature Filtering: Retain only amplicon sequence variants (ASVs) with a minimum frequency of 10 across all samples to minimize sequencing artifacts [52].
- Normalization: Apply appropriate normalization methods to handle compositionality. OneNet incorporates methods including Centered Log Ratio (CLR) and Geometric Mean of Pairwise Ratios (GMPR) [10].
OneNet Consensus Network Inference
- Bootstrap Resampling: Generate B bootstrap subsamples (B = 100 recommended) from the original abundance matrix by randomly selecting subsets of samples (n' = 0.8n if n ≤ 144, otherwise n' = 10√n) [24] [10].
- Multi-Method Application: Apply each of the seven integrated inference methods (Magma, SpiecEasi, gCoda, PLNnetwork, EMtree, SPRING, and ZiLN) to each bootstrap subsample across a fixed regularization parameter grid (λ1, …, λK) [10].
Edge Frequency Calculation: For each edge e and parameter λk, compute the selection frequency across bootstrap samples as:
fek = (1/B) × Σb=1 to B 1{e ∈ Gb,k}
where 1{e ∈ Gb,k} is the indicator function for edge inclusion [24] [10].
- Consensus Network Construction: Select an optimal λ* for each method to achieve comparable network density, then combine edges with high selection frequencies across methods to generate the final consensus network [24].
Guild Identification and Validation
- Network Clustering: Apply community detection algorithms (e.g., Markov clustering, affinity propagation) to identify densely connected node clusters representing potential microbial guilds [41].
- Guild Characterization: Annotate identified guilds with taxonomic and functional information. Cross-reference with known cirrhosis-associated taxa (see Table 1) for biological validation [49].
- Statistical Validation: Use permutation-based approaches to assess the significance of identified guilds and their association with clinical metadata (e.g., Child-Pugh score, MELD score) [41].
Signaling Pathways in Cirrhosis-Associated Guilds
Microbial guilds identified through network inference influence liver pathology through several key pathways along the gut-liver axis, as illustrated below:
The diagram illustrates how cirrhosis-associated microbial guilds contribute to disease progression through multiple interconnected pathways: (1) reduced SCFA production leading to impaired intestinal barrier function, (2) increased microbial translocation of pathogen-associated molecular patterns (PAMPs) like LPS, (3) hepatic inflammation via TLR4 activation in Kupffer cells, (4) altered bile acid metabolism disrupting FXR/FGF19 signaling, and (5) ammonia production by urease-containing bacteria contributing to hepatic encephalopathy [51] [47] [49].
The Scientist's Toolkit: Research Reagent Solutions
Table 3: Essential Research Reagents and Resources for Microbial Guild Analysis
| Reagent/Resource | Function/Application | Example Specifications |
|---|---|---|
| DNA Extraction Kits | High-efficiency bacterial DNA extraction from fecal samples | Protocols for mechanical lysis of Gram-positive bacteria; inhibitor removal |
| 16S rRNA Primers | Amplification of variable regions for taxonomic profiling | V4 region primers (515F/806R) with dual-index barcoding for multiplexing |
| Shotgun Metagenomic Library Prep Kits | Whole-genome sequencing of microbial communities | Fragmentation, adapter ligation, and PCR amplification for Illumina compatibility |
| QIIME2 Platform | End-to-end microbiome analysis pipeline | Quality filtering, denoising (DADA2), taxonomic assignment, and diversity analysis [52] |
| OneNet R Package | Consensus network inference from microbiome data | Implements 7 inference methods with stability selection [24] [10] |
| mina R Package | Microbial community diversity and network analysis | Network comparison using spectral distances; cluster-based diversity metrics [41] |
| Greengenes Database | Taxonomic reference database for 16S data | 13_8 version with 99% OTU clusters for taxonomic assignment [52] |
| PICRUSt2 | Phylogenetic investigation of community function | Predicts metagenome functional content from 16S data [52] |
Consensus network inference with OneNet provides a robust framework for identifying microbial guilds in liver cirrhosis, overcoming the limitations of individual inference methods that often generate conflicting networks [24]. The application of this methodology to well-characterized cirrhotic cohorts has revealed a reproducible "cirrhotic cluster" of co-occurring bacteria associated with degraded clinical status [24]. These guilds exhibit characteristic functional impairments, including reduced SCFA production and increased LPS biosynthesis, which contribute to disease progression through the mechanistic pathways outlined above [52] [47].
Future applications of network inference in cirrhosis research should focus on longitudinal sampling to capture dynamic guild rearrangements during disease progression and therapeutic interventions [3]. Integration of multi-omics data, including metabolomics and inflammatory markers, will further elucidate the functional consequences of guild interactions [50]. Ultimately, microbiome network analysis offers promising avenues for developing guild-targeted interventions, including personalized probiotics, prebiotics, and fecal microbiota transplantation, to restore gut-liver axis homeostasis in cirrhotic patients [48] [47].
Navigating Pitfalls: Optimization Strategies for Robust Networks
In microbiome research, the path from raw sequencing data to robust biological insights is paved with critical preprocessing decisions. Data transformation and normalization are not merely procedural steps; they are foundational to the validity of downstream network inference and interaction analysis. The complex nature of microbiome data—characterized by its compositionality, high sparsity, and technical artifacts—necessitates careful handling to avoid spurious conclusions. As we frame this within the context of microbiome network inference research, it becomes evident that preprocessing choices directly influence our ability to discern true ecological interactions from technical artifacts. This protocol examines three fundamental preprocessing procedures—rarefaction, centered log-ratio (CLR) transformation, and zero handling—through the lens of their impact on subsequent network analysis, providing evidence-based guidance for researchers and drug development professionals navigating this complex landscape.
Core Concepts and Methodological Comparisons
The Nature of Microbiome Data and Preprocessing Challenges
Microbiome data generated from 16S rRNA gene sequencing presents several unique characteristics that complicate statistical analysis. The data is inherently compositional, meaning that the abundances of taxa are not independent because they sum to a constant (the total read count per sample) [53]. This compositionality resides in a simplex space rather than the entire Euclidean space, violating assumptions of many standard statistical methods [54]. Additionally, microbiome data is typically sparse, with abundance matrices containing up to 90% zeros [55]. These zeros can arise from different sources: true biological absence (structural zeros), limited sequencing depth (sampling zeros), or technical errors (outlier zeros) [54]. Furthermore, microbiome data exhibits over-dispersion, where abundances of features show high variability, and suffers from differing sequencing depths across samples, which can confound true biological signals with technical artifacts [55].
Table 1: Key Characteristics of Microbiome Data That Impact Preprocessing
| Characteristic | Description | Impact on Analysis |
|---|---|---|
| Compositionality | Data represents relative proportions that sum to a constant [53] | Violates independence assumptions; risk of spurious correlations |
| High Sparsity | Up to 90% zeros in abundance matrices [55] | Challenges diversity estimates and statistical modeling |
| Over-dispersion | High variability in feature abundances across samples | Inflated variance estimates; reduced power for differential abundance testing |
| Variable Sequencing Depth | Different total reads per sample | Can confound biological signals with technical artifacts |
Comparative Analysis of Preprocessing Approaches
The table below summarizes the primary preprocessing methods discussed in this protocol, their underlying principles, advantages, and limitations, with particular emphasis on their relevance to network inference.
Table 2: Comparative Analysis of Microbiome Data Preprocessing Methods
| Method | Principle | Advantages | Limitations | Suitability for Network Inference |
|---|---|---|---|---|
| Rarefaction | Subsampling without replacement to equal sequencing depth [56] | Simple; addresses library size differences for diversity analysis [56] | Discards data; introduces artificial uncertainty [53] [57]; high false positive rates in DA testing [58] | Limited—may reduce power for detecting interactions |
| CLR Transformation | Log-ratio transformation using geometric mean of all features as denominator [58] [59] | Compositionally aware [59]; preserves all features [58] | Sensitive to zeros; geometric mean calculation affected by sparse data [58] | High—accounts for compositionality while preserving data structure |
| ANCOM-BC | Accounts for sampling fractions and compositionality through bias correction [55] | Specifically designed for compositional data; controls FDR | Complex implementation; computationally intensive | Moderate-High—addresses key limitations but requires careful implementation |
| Proportion-Based | Convert counts to relative abundances by dividing by total reads [59] | Simple; preserves all data; outperforms in some ML applications [59] | Does not address compositionality; problematic for correlation-based networks | Moderate—use with caution for interaction analysis |
| Pseudo-Count Addition | Add small value (e.g., 1) to all counts before transformation [53] | Enables log-transformation of zero-inflated data | Ad-hoc; results sensitive to choice of pseudo-count [53] | Low—may introduce artifacts in network inference |
Protocols for Data Preprocessing
Protocol 1: Rarefaction for Diversity Analysis
Rarefaction remains a common approach for standardizing sequencing depth, particularly for alpha and beta diversity analyses. The following protocol outlines its proper implementation and interpretation.
Experimental Workflow for Rarefaction
The diagram below illustrates the key decision points and steps in the rarefaction protocol for microbiome data analysis.
Step-by-Step Methodology
Library Size Assessment: Compute total read counts for each sample in your feature table. Generate a summary table showing the distribution of library sizes across all samples, noting the minimum, maximum, and median values. Samples with library sizes below a reasonable threshold (e.g., <10,000 reads for 16S data) may need to be excluded from downstream analysis [56].
Rarefaction Curve Generation: Using tools like QIIME2's
diversity alpha-rarefactioncommand, create rarefaction curves plotting diversity metrics against sequencing depth [56]. Employ multiple alpha diversity metrics simultaneously (e.g., observed features, Shannon index, Faith's PD) to gain comprehensive insights.Depth Selection: Identify the point where diversity metrics plateau, indicating sufficient sequencing depth has been reached to capture the majority of diversity. Compare this with the percentage of samples retained at various depths. Select a rarefaction depth that maximizes both diversity capture and sample retention [56]. As a guideline, rarefaction is most beneficial when library sizes vary by more than 10-fold [56].
Subsampling Execution: Implement subsampling without replacement to the selected depth using established algorithms. In QIIME2, this is automatically handled by the
core-metrics-phylogeneticpipeline when the--p-sampling-depthparameter is specified [56].Quality Assessment: Verify the rarefaction process by comparing pre- and post-rarefaction sample counts and diversity metrics. Document the number of samples retained and any potential biases introduced by sample exclusion.
Table 3: Key Considerations for Rarefaction Depth Selection
| Consideration | Guideline | Rationale |
|---|---|---|
| Diversity Plateau | Select depth where curves approach slope of zero [56] | Ensures sufficient sampling to capture true diversity |
| Sample Retention | Retain >80% of samples typically recommended | Balances statistical power with data quality |
| Library Size Variation | Apply when >10x difference in library sizes [56] | Targets cases where technical variation dominates |
| Downstream Application | Use primarily for diversity analysis [58] | Not recommended for differential abundance testing |
Protocol 2: Centered Log-Ratio (CLR) Transformation for Compositional Data
The CLR transformation addresses the compositional nature of microbiome data, making it particularly suitable for correlation-based network inference approaches.
Workflow for CLR Transformation
The following diagram outlines the key steps in applying CLR transformation to microbiome data, highlighting critical decision points for handling zeros.
Step-by-Step Methodology
Pre-Filtering: Remove low-prevalence features to reduce noise and computational complexity. A common threshold is to retain only features present in at least 10% of samples [59]. Document the number of features removed to ensure biological relevance is maintained.
Zero Handling: Address zero values using one of two approaches:
- Imputation Methods: Apply sophisticated imputation techniques such as Bayesian models (e.g., mbImpute) or k-nearest neighbors (k-NN) to estimate likely values for zeros [55]. Avoid simple pseudo-count additions which can introduce artifacts [53].
- Integrated Modeling: Utilize tools like ALDEx2 that incorporate zero handling directly into their compositional framework through Monte-Carlo sampling from a Dirichlet distribution [58].
Geometric Mean Calculation: For each sample, calculate the geometric mean of all feature abundances. The geometric mean for a sample with features x₁, x₂, ..., xₙ is defined as (∏xᵢ)¹/ⁿ. This serves as the reference denominator for the log-ratio transformation.
CLR Transformation: Apply the CLR transformation to each feature in each sample using the formula: CLR(xᵢ) = log(xᵢ / g(𝐱)), where xᵢ is the abundance of feature i and g(𝐱) is the geometric mean of all features in the sample [58] [59]. This transformation moves the data from the simplex to real space, addressing the compositional nature.
Validation: Assess the transformation by examining the distribution of transformed values and verifying that technical artifacts (e.g., sequencing depth effects) have been mitigated while biological signal is preserved.
Protocol 3: Handling Excess Zeros in Microbiome Data
The prevalence of zeros in microbiome datasets presents significant challenges for both statistical analysis and network inference. This protocol provides a structured approach to identifying and addressing different types of zeros.
Experimental Workflow for Zero Handling
The diagram below illustrates a systematic approach to classifying and addressing different types of zeros in microbiome data.
Step-by-Step Methodology
Zero Classification: Categorize zeros into three main types based on their likely origin:
- Structural Zeros: Represent true biological absence of a taxon in certain sample groups or environments. These can be identified through prevalence patterns across experimental groups [54].
- Sampling Zeros: Arise from insufficient sequencing depth to detect low-abundance taxa that are actually present. These often show random patterns across samples [54].
- Technical Zeros: Result from experimental artifacts, processing errors, or contamination. These may appear as outliers in otherwise prevalent taxa [54].
Type-Specific Handling Strategies:
- Structural Zeros: Exclude these from differential analysis between groups where the taxon is structurally absent, as they represent genuine biological differences rather than missing data [54].
- Sampling Zeros: Apply model-based imputation approaches that account for the compositional nature of the data. Methods like those implemented in ANCOM-II provide a framework for handling these zeros [54].
- Technical Zeros: Identify through outlier detection methods and either exclude or correct based on the specific technical artifact identified.
Implementation Tools: Utilize specialized software packages designed for microbiome zero handling:
- ANCOM-II: Implements a framework to classify and handle different zero types [54].
- mbImpute: Uses matrix completion-based approach to impute likely values for sampling zeros [55].
- ZINB-WaVE: Employs zero-inflated negative binomial models to account for excess zeros in differential abundance testing.
Validation: Where possible, validate zero handling approaches using mock communities with known compositions or spike-in controls. Assess the impact of different zero handling strategies on downstream network inference results through sensitivity analyses.
The Scientist's Toolkit: Essential Research Reagents and Computational Tools
Table 4: Essential Computational Tools for Microbiome Data Preprocessing
| Tool/Resource | Function | Application Context | Key Reference |
|---|---|---|---|
| QIIME 2 | End-to-end microbiome analysis platform | Rarefaction, diversity analysis, basic normalization | [56] |
| ALDEx 2 | Compositional data analysis using CLR | Differential abundance, accounting for compositionality | [58] |
| ANCOM-II | Differential abundance accounting for zeros | Identifying and handling different zero types | [54] |
| DESeq2 | Negative binomial-based differential abundance | Raw count data analysis (with caution for compositionality) | [58] [55] |
| PhILR | Phylogenetic isometric log-ratio transformation | Compositionally aware transformation using phylogenetic trees | [59] |
| mbImpute | Model-based imputation for zeros | Handling sampling zeros in sparse microbiome data | [55] |
| MDSINE2 | Dynamical systems modeling for timeseries | Network inference from longitudinal data | [19] |
The preprocessing decisions detailed in this protocol—rarefaction, CLR transformation, and zero handling—are not isolated technical considerations but foundational elements that directly shape the validity and interpretability of microbiome network inference. Within the broader context of microbiome interaction analysis research, these methods enable researchers to distinguish true biological relationships from technical artifacts. The evidence-based guidelines presented here emphasize that there is no universal preprocessing solution; rather, the choice depends on the specific research question, data characteristics, and intended analytical approach. By implementing these structured protocols and utilizing the provided toolkit, researchers can enhance the reliability of their network inferences, ultimately advancing our understanding of microbial ecosystems and their implications for human health and drug development.
In microbiome network inference research, the management of rare taxa represents a critical, yet unresolved, challenge in data pre-processing. Microbial community sequencing data are characteristically sparse, containing a high proportion of low-abundance taxa that appear infrequently across samples [44]. These rare taxa can introduce statistical noise and spurious correlations during co-occurrence network analysis, potentially compromising the biological validity of inferred microbial interactions [23]. Prevalence filtering—the process of removing taxa that do not appear in a minimum percentage of samples—serves as a fundamental step to mitigate these issues. However, the selection of appropriate prevalence thresholds remains contentious, with practices varying considerably across studies and directly impacting downstream ecological interpretations [23] [60]. This Application Note provides a structured framework for implementing prevalence filtering, consolidating current methodological evidence and providing practical protocols for researchers engaged in microbiome interaction analysis.
Empirical studies demonstrate significant variation in prevalence threshold selection, reflecting a trade-off between inclusivity of the rare biosphere and analytical accuracy. The table below summarizes the range of prevalence thresholds implemented in contemporary microbiome network studies.
Table 1: Prevalence Filtering Thresholds in Microbiome Network Studies
| Prevalence Threshold | Reported Applications | Key Considerations |
|---|---|---|
| >10% | Cross-environment soil microbiome comparisons [23]; Analysis of 38 diverse datasets [60] | Maximizes feature retention; Higher risk of spurious correlations from rare taxa |
| >20% | Commonly recommended starting point [23] | Balances statistical reliability with biological coverage |
| >33% | Within-host human microbiome studies (skin, lung) [23] | Suitable for well-sampled habitats; Removes a significant portion of rare biosphere |
| >60% | Specific hypothesis-driven studies [23] | Maximizes analytical stringency; Useful for core microbiome characterization |
The selection of an optimal threshold is context-dependent, influenced by study-specific factors including sampling depth, habitat type, and biological question. Across 38 microbiome datasets, application of a 10% prevalence filter substantially altered differential abundance results, confirming that analytical outcomes are sensitive to this parameter [60]. Higher thresholds (e.g., 20-33%) generally improve statistical confidence in co-occurrence inference by reducing zero-inflation, which disproportionately affects the detection of negative associations [23].
Experimental Protocol for Threshold Selection
This section provides a standardized workflow for determining and implementing prevalence filtering in microbiome network inference analyses.
Materials and Reagents
Table 2: Essential Research Reagent Solutions for Prevalence Filtering
| Item | Function | Implementation Examples |
|---|---|---|
| Amplicon Sequence Variant (ASV) Table | Raw count data from sequencing pipelines; Fundamental unit for prevalence calculation | DADA2 [23]; Deblur |
| Bioinformatics Platform | Computational environment for data filtering and transformation | R; Python; QIIME 2 |
| Prevalence Calculation Script | Custom code to compute taxa occurrence across samples | R phyloseq package; Custom Python scripts |
| Network Inference Software | Tools to construct co-occurrence networks post-filtering | SPIEC-EASI [23]; SparCC [23]; CoNet |
Step-by-Step Procedure
Data Preparation: Begin with a quality-filtered ASV or OTU table. Ensure that non-biological zeros (e.g., due to sequencing depth) have been addressed through appropriate normalization techniques. Note that rarefaction can interact with prevalence filtering and requires careful consideration based on the chosen network inference method [23].
Prevalence Calculation: For each taxon, calculate prevalence as the proportion of samples in which it is detected (abundance > 0). This creates a prevalence vector for the entire feature set.
Threshold Evaluation:
- Generate a prevalence distribution plot (histogram) to visualize the proportion of rare versus common taxa.
- Calculate the number of taxa retained at candidate thresholds (e.g., 10%, 20%, 33%).
- For hypothesis-driven studies focusing on core community interactions, apply higher thresholds (>30%). For exploratory analyses aiming to capture community diversity, consider more liberal thresholds (10-20%).
Filter Implementation: Remove all taxa with prevalence below the selected threshold from the ASV/OTU table. Retain the filtered table for downstream network construction.
Sensitivity Analysis (Recommended): Conduct network inference across a range of thresholds (e.g., 10%, 15%, 20%, 25%) and compare key network properties (number of nodes, edges, connectivity) to evaluate robustness.
Figure 1: Workflow for prevalence filtering and threshold selection in microbiome network analysis.
Methodological Considerations and Best Practices
Interplay with Data Compositionality
Microbiome data are compositional, meaning that abundances represent relative proportions rather than absolute counts. Prevalence filtering should be performed prior to compositional data transformations, such as the center-log ratio (CLR) transformation used by tools like SPIEC-EASI and ALDEx2 [23] [60]. When analyzing inter-kingdom data (e.g., bacteria and fungi), apply prevalence filtering separately to each domain before concatenation to avoid technical biases [23].
Impact on Ecological Inference
The decision to filter rare taxa involves fundamental trade-offs. While reducing false positives, aggressive filtering may eliminate ecologically significant rare taxa that contribute to ecosystem functioning or serve as keystone species under specific conditions [23]. The optimal threshold often depends on whether the study aims to reconstruct the core interacting community or capture the full diversity of potential associations, including those involving conditionally rare taxa.
Reporting Standards
For reproducibility, explicitly document in methods sections:
- The specific prevalence threshold used (e.g., "10% prevalence filter")
- The rationale for threshold selection
- The number of taxa filtered and retained
- Any sensitivity analyses performed
Table 3: Impact of Prevalence Filtering on Downstream Analysis
| Analytical Stage | Effect of Low Threshold (10%) | Effect of High Threshold (30%) |
|---|---|---|
| Network Complexity | Higher node count; Increased edge density | Simplified topology; Fewer nodes and edges |
| Rare Biosphere | Partially retained; Potential ecological insights | Largely excluded; Focus on core community |
| Statistical Confidence | Lower confidence in edges; More potential false positives | Higher confidence in inferred interactions |
| Computational Demand | Increased processing time for network inference | Reduced computational requirements |
Figure 2: Analytical trade-offs associated with low versus high prevalence filtering thresholds.
Prevalence filtering represents an essential pre-processing step in microbiome network inference that directly impacts biological conclusions. There is no universal threshold applicable to all studies; rather, selection should be guided by study objectives, sampling depth, and habitat characteristics. A 10-20% prevalence threshold provides a reasonable starting point for many investigations, though sensitivity analyses across multiple thresholds are strongly recommended to establish analytical robustness. As microbiome network inference continues to evolve, developing standardized approaches for handling rare taxa will be crucial for generating biologically meaningful interaction networks that advance our understanding of microbial community dynamics.
In microbiome research, environmental confounders represent variables such as pH, moisture, oxygen levels, and nutrient availability that can simultaneously influence the abundance of multiple microbial taxa, thereby creating spurious associations in network inference analyses [61]. The fundamental challenge lies in distinguishing true biotic interactions—such as cross-feeding or competition—from associations driven by shared environmental responses [61] [17]. Microbial network construction is a popular exploratory technique for deriving hypotheses from high-throughput sequencing data, but its biological interpretation remains problematic when environmental heterogeneity exists across samples [61]. Since microbial communities are strongly shaped by their environmental context, failing to account for these factors can lead to networks dominated by environmentally induced correlations rather than biological interactions, potentially compromising downstream applications in drug development and therapeutic discovery [61] [17].
The process of inferring microbial interactions from abundance data is further complicated by the compositional nature of sequencing data, where abundances represent relative proportions rather than absolute counts [17] [60]. This characteristic, combined with high dimensionality, sparsity, and technical variability, creates a complex analytical landscape where environmental confounders can significantly distort biological interpretations [62] [60]. Researchers must therefore employ robust statistical and experimental strategies to mitigate these effects, ensuring that inferred networks more accurately reflect true biological relationships rather than environmental artifacts.
Strategic Framework for Confronting Confounders
Categorization of Adjustment Strategies
Multiple statistical and experimental approaches have been developed to address environmental confounding in microbiome network inference. Each strategy offers distinct advantages and limitations, making them differentially suitable for specific research contexts and data types. The most prevalent methodologies can be categorized into four primary approaches: environment-as-node, sample stratification, environmental regression, and post-inference filtering [61].
The environment-as-node approach incorporates environmental parameters directly as nodes within the network, enabling visualization of direct associations between microbial taxa and specific environmental variables [61]. Sample stratification involves partitioning samples into more homogeneous groups based on key environmental gradients or clustering approaches before constructing separate networks for each subgroup [61]. Environmental regression employs statistical models to regress out the effect of environmental parameters from abundance data, with network inference subsequently performed on the residuals [61]. Finally, post-inference filtering applies algorithmic rules to remove edges from constructed networks that likely represent environmentally induced indirect connections rather than direct biotic interactions [61].
Table 1: Comparative Analysis of Strategies for Managing Environmental Confounders in Microbiome Networks
| Strategy | Mechanism | Advantages | Limitations | Best-Suited Applications |
|---|---|---|---|---|
| Environment-as-Node | Includes environmental parameters as additional nodes in correlation networks | Simple implementation; Direct visualization of taxon-environment associations; Available in tools like CoNet and FlashWeave | Does not statistically control for confounders; Network edges still reflect mixed biotic/environmental signals | Exploratory analysis to identify potential environmental drivers structuring communities |
| Sample Stratification | Splits samples into homogeneous groups before network construction | Reduces within-group environmental variation; Simplifies interaction detection | Reduces sample size and statistical power; Requires identifiable discrete environmental states | Case-control studies or when clear environmental groupings exist (e.g., health status, depth gradients) |
| Environmental Regression | Regresses out environmental effects prior to network inference | Statistically controls for continuous and categorical environmental variables; Maintains sample size | Assumes linear (or known nonlinear) responses; Risk of overfitting with many parameters | When quantitative environmental measurements are available and response relationships are well-characterized |
| Post-Inference Filtering | Removes environmentally-induced edges after network construction (e.g., lowest MI in triplets) | Does not require pre-specified environmental variables; Uses network topology itself | May remove some true biotic interactions; Requires careful parameter tuning | When environmental data is incomplete but network topology shows characteristic indirect connection patterns |
Experimental Design Considerations for Confounding Control
Optimal management of environmental confounders begins with appropriate experimental design rather than merely relying on post-hoc statistical adjustments [61] [63]. Research objectives should clearly determine whether environmental factors represent signals of interest or nuisances to be controlled. When investigating biotic interactions, studies should ideally be designed to minimize environmental heterogeneity through careful sampling schemes, though this must be balanced against the need for ecological representativeness [61].
Sample processing protocols significantly impact downstream analyses, with intra-sample heterogeneity representing a substantial source of variability. Studies demonstrate that different sub-sections of the same stool sample can yield dramatically different microbial abundance profiles due to microenvironments hosting distinct bacterial populations [63]. For instance, Firmicutes and Bifidobacterium spp. show significantly different abundances between inner and outer regions of stool samples [63]. This variability can be substantially reduced through comprehensive homogenization protocols, such as grinding entire frozen stool samples in liquid nitrogen until achieving a fine powder before sub-sampling [63].
Temporal factors also introduce confounding effects. Evidence indicates that room temperature storage beyond 15 minutes significantly alters the detection of major bacterial phyla, with Bacteroidetes decreasing and Firmicutes increasing after 30 minutes at room temperature [63]. Similarly, storage in domestic frost-free freezers beyond three days affects bacterial taxa detection, emphasizing the need for standardized processing timelines [63]. These findings support the recommendation that stool samples should be frozen within 15 minutes of defecation and homogenized prior to DNA extraction to minimize technical variability that could confound network inference [63].
Detailed Methodological Protocols
Sample Homogenization and Processing Protocol
Objective: To minimize intra-sample variability in microbial community profiles through standardized homogenization procedures, thereby reducing technical confounders in downstream network analyses.
Materials:
- Liquid nitrogen
- Mortar and pestle (autoclavable)
- Cryogenic storage vials
- Digital scale
- Safety equipment (cryogenic gloves, face shield, lab coat)
Procedure:
- Immediate Processing: Freeze entire stool samples at -80°C within 15 minutes of collection to prevent compositional changes [63].
- Cryogenic Homogenization:
- Transfer frozen sample to mortar containing liquid nitrogen.
- Grind sample thoroughly using pestle until a fine, homogeneous powder is achieved.
- Maintain liquid nitrogen coverage throughout grinding to preserve sample integrity.
- Representative Subsampling:
- Transfer the resulting frozen powder to a sterile container.
- Subsample from this homogenized powder for DNA extraction rather than from original heterogeneous sample.
- Quality Assessment:
- Compare variance across multiple technical replicates from homogenized versus non-homogenized samples.
- Expected outcome: Significant reduction in variance for major bacterial taxa (e.g., from >10^13 to <10^10 based on qPCR data) [63].
Validation Metrics: Quantify reduction in technical variance using Levene's test or similar variance equality tests comparing multiple subsamples from homogenized versus non-homogenized material [63].
Computational Adjustment for Environmental Confounders
Objective: To statistically account for environmental covariates during microbial network inference using regression-based approaches.
Materials:
- Normalized microbiome abundance table (e.g., CSS-normalized counts, CLR-transformed abundances)
- Environmental metadata matrix (continuous and/or categorical)
- Statistical software environment (R/Python)
Procedure:
- Data Preprocessing:
- Model Specification:
- For each microbial taxon, fit a regression model with environmental factors as predictors:
- Consider nonlinear terms or interaction effects if biologically justified.
- Residual Extraction:
- Extract residuals from the fitted models, representing microbial variation unexplained by environmental factors.
- Network Construction:
- Calculate association measures (e.g., SparCC, SPIEC-EASI) using the residualized abundances.
- Apply appropriate significance thresholds and multiple testing corrections.
Validation: Assess the proportion of variance explained by environmental factors (R²) for each taxon to identify which microbes are most strongly environmentally mediated.
Figure 1: Computational workflow for environmental confounder adjustment in microbiome network inference.
Essential Research Reagents and Computational Tools
Table 2: Research Reagent Solutions for Environmental Confounding Management
| Category | Item | Specification/Function | Application Notes |
|---|---|---|---|
| Sample Collection & Storage | Cryogenic Storage Vials | 2mL screw-cap with O-ring | Maintain sample integrity at -80°C; prevent freeze-thaw cycles |
| Liquid Nitrogen | LN₂ for cryogenic grinding | Enables homogenization without microbial compositional changes | |
| RNAlater | RNA/DNA stabilization solution | Avoid for bacterial taxa detection; reduces overall DNA yields [63] | |
| DNA Extraction & QC | Homogenization Equipment | Mortar and pestle, bead beater | Critical for reducing intra-sample variability [63] |
| DNA Extraction Kit | MoBio PowerSoil, DNeasy | Standardized across all samples; include extraction controls | |
| Computational Tools | R Environment | v4.0+ with phyloseq, microbiome packages | Primary platform for statistical analysis and visualization |
| Normalization Tools | CSS (metagenomeSeq), CLR (ALDEx2) | Account for sequencing depth and compositionality [62] [60] | |
| Network Inference | FlashWeave, CoNet, SPIEC-EASI | Handle environmental nodes or conditional dependencies [61] [17] | |
| Batch Correction | ComBat, RemoveBatchEffect | Address technical artifacts when environmental data unavailable [62] |
Integrated Workflow for Comprehensive Confrontation of Confounders
Successful management of environmental confounders requires an integrated approach spanning experimental design, sample processing, and computational analysis. The following workflow synthesizes the most effective strategies into a coherent protocol for researchers conducting microbiome network inference studies.
Phase 1: Experimental Design
- Clearly define whether environmental factors represent signals of interest or nuisances
- Implement stratified sampling when possible to create environmentally homogeneous groups
- Include appropriate replication to account for residual environmental heterogeneity
- Standardize collection timing and conditions to minimize unintentional environmental variation
Phase 2: Sample Processing
- Process samples immediately after collection (freeze within 15 minutes for stool)
- Employ cryogenic homogenization of entire samples before subsampling
- Utilize standardized storage conditions (avoid frost-free freezers for long-term storage)
- Minimize freeze-thaw cycles (limit to ≤4 cycles based on experimental evidence) [63]
Phase 3: Computational Analysis
- Select appropriate normalization strategy based on data characteristics (CSS for zero-inflated data, CLR for compositional data)
- Apply multiple complementary approaches for environmental adjustment (e.g., regression + post-filtering)
- Validate results sensitivity across different methodological choices
- Employ consensus approaches when possible to identify robust network features
Figure 2: Integrated workflow for confronting environmental confounders across the research pipeline.
This comprehensive approach to managing environmental confounders enhances the biological validity of inferred microbial networks, enabling more accurate predictions of microbial interactions and strengthening subsequent applications in therapeutic development and microbiome engineering.
In microbiome research, network inference is a powerful tool for deciphering the complex web of interactions between microbial taxa. These interactions collectively influence host health and ecosystem function [38] [3]. A fundamental challenge in constructing these networks from high-dimensional sequencing data—characterized by its sparse, over-dispersed, and compositionally constrained nature—is controlling network density. Sparsity, the assumption that true biological networks contain only a limited number of strong interactions, is a crucial principle for extracting meaningful ecological signals from statistical noise. Regularization techniques operationalize this principle by introducing tuning parameters, or hyperparameters, that penalize model complexity, thereby controlling the number of edges inferred in the network. This document provides detailed application notes and protocols for tuning these hyperparameters to achieve biologically plausible network density, framed within the broader thesis of robust microbiome interaction analysis.
Theoretical Foundations of Regularization for Sparsity
Microbiome data presents specific characteristics that make regularization essential for network inference. The number of taxa (p) is often much larger than the number of samples (n), making standard statistical models prone to overfitting. Furthermore, the data is compositional, meaning that abundances represent relative rather than absolute quantities [3].
The Regularization Objective
A common approach to network inference involves estimating a precision matrix (the inverse of the covariance matrix), where a non-zero entry indicates a conditional dependence between two taxa. To induce sparsity, a penalty term is added to the likelihood function. The core objective function for many models, including Graphical Lasso (Glasso), is:
[ \text{max}_{\Theta} \left[ \log(\det(\Theta)) - \text{trace}(S\Theta) - \lambda P(\Theta) \right] ]
Here, (\Theta) is the precision matrix, (S) is the sample covariance matrix, (\lambda) is the non-negative regularization hyperparameter, and (P(\Theta)) is a penalty function that encourages sparsity in (\Theta) [38].
Common Penalty Functions
The choice of (P(\Theta)) defines the properties of the regularization.
- L1 Regularization (Lasso): (P(\Theta) = \|\Theta\|1 = \sum{i \neq j} |\theta_{ij}|). This is the most common penalty, implemented in Glasso. It forces some entries in the precision matrix to be exactly zero, effectively performing variable selection and controlling network density [38].
- Fused Lasso: This penalty is novel in the context of microbiome networks and is designed for grouped samples from different environments or time points. It retains environment-specific signals while sharing information across groups. The penalty encourages not only sparsity but also similarity between related networks [18].
The hyperparameter (\lambda) directly controls the strength of this penalty. As (\lambda) increases, the penalty term dominates, forcing more elements of (\Theta) to zero and resulting in a sparser network.
Quantitative Comparison of Regularization Methods
The table below summarizes key regularization-based methods for microbiome network inference, highlighting their core approaches and the hyperparameters that govern network density.
Table 1: Microbiome Network Inference Methods Utilizing Regularization
| Method | Core Approach | Regularization Technique | Key Hyperparameter(s) Controlling Density | Reported Optimal Density Range/Strategy |
|---|---|---|---|---|
| HARMONIES [38] | ZINB normalization + Gaussian Graphical Model | L1-penalty on the precision matrix (Glasso) | (\lambda) (penalty parameter in Glasso) | Selected via stability-based approach (e.g., StARS) to ensure sparse and stable networks. |
| LUPINE_single [3] | Partial correlation via one-dimensional PCA approximation | Not explicitly stated, but partial correlation inherently handles high dimensionality. | Number of principal components used for deflation. | Simulation studies suggest a single component is more accurate for small sample sizes. |
| LUPINE [3] | Longitudinal partial correlation via PLS regression | Not explicitly stated, leverages low-dimensional representation. | Number of latent components in PLS/blockPLS regression. | User exploration of different component numbers is recommended. |
| fuser [18] | Fused Lasso for grouped samples | Combined L1 penalty for sparsity and a fusion penalty for inter-group similarity. | (\lambda1) (sparsity), (\lambda2) (fusion strength). | Outperforms standard lasso in cross-environment (All) prediction scenarios, reducing false positives and negatives. |
Experimental Protocols for Hyperparameter Tuning
Selecting the optimal hyperparameter is critical. The following protocols outline rigorous, data-driven procedures.
Protocol: Stability Approach for Regularization Selection (StARS)
This protocol is ideal for methods like HARMONIES that use Glasso, aiming to find the sparsest model that is highly stable under data resampling [38].
- Input: Preprocessed (n \times p) microbiome abundance matrix (e.g., normalized counts).
- Parameter Grid: Define a sequence of (\lambda) values, typically on a logarithmic scale (e.g., from 0.01 to 1).
- Subsampling: For each (\lambda), draw (N) (e.g., 100) random subsamples of the data without replacement, each of size (b(n) = \lfloor \sqrt{n} \rfloor).
- Network Estimation: Infer a network from each subsample.
- Stability Calculation:
- For each pair of taxa ((i, j)), calculate the proportion of subsamples (\hat{\psi}{ij}(\lambda)) in which an edge is present.
- The overall instability of the network is defined as: (\hat{D}(\lambda) = \sum{i
- Optimal (\lambda) Selection: The optimal (\hat{\lambda}) is the smallest (\lambda) for which the instability (\hat{D}(\lambda)) falls below a pre-defined tolerance threshold (\beta) (e.g., 0.05). This selects the sparsest stable model.
Protocol: Same-All Cross-Validation (SAC)
This protocol, used to evaluate the fuser algorithm, is designed to test how well a model generalizes across different environmental niches, which is crucial for selecting hyperparameters that are robust to ecological heterogeneity [18].
- Input: Grouped microbiome data (e.g., from different body sites, time points, or treatments).
- Preprocessing: Apply (\log_{10}(x+1)) transformation to OTU counts. Standardize group sizes by randomly subsampling an equal number of samples from each group. Remove low-prevalence OTUs.
- Validation Regimes:
- Same Regime: Perform k-fold cross-validation (e.g., k=5) within a single, homogeneous environmental group. This tests performance within a known niche.
- All Regime: Perform k-fold cross-validation on the entire dataset with samples pooled from multiple environments. This tests performance in a generalized, cross-niche setting.
- Model Training & Evaluation: For each candidate set of hyperparameters (e.g., (\lambda1, \lambda2) for
fuser), train the model on the training folds and evaluate its predictive accuracy on the held-out test folds. The evaluation metric is typically test error or another predictive score. - Hyperparameter Selection: Choose the hyperparameters that minimize the test error in the target regime. The
fuseralgorithm, for instance, is shown to perform well in the challenging "All" regime, sharing information between habitats while preserving niche-specific edges [18].
Workflow Visualization for Hyperparameter Tuning
The following diagram illustrates the logical flow of a comprehensive hyperparameter tuning and network evaluation process, integrating the StARS and SAC protocols.
The Scientist's Toolkit: Research Reagent Solutions
In the computational domain of microbiome network inference, "research reagents" equate to software tools, algorithms, and data resources. The following table details essential components of the methodological toolkit.
Table 2: Essential Research Reagent Solutions for Network Inference
| Item Name | Function / Role in Experiment | Example / Implementation |
|---|---|---|
| HARMONIES R Package [38] | Provides a complete pipeline for microbiome network inference, integrating ZINB-based normalization and sparse precision matrix estimation with Glasso. | Available at: https://github.com/shuangj00/HARMONIES |
| Graphical Lasso (Glasso) [38] | Core algorithm for estimating a sparse precision matrix. The primary tool for inducing sparsity via L1 regularization. | Implemented in R packages like glasso and huge. |
| fuser Algorithm [18] | An implementation of the fused lasso for microbiome data, enabling the inference of distinct, environment-specific networks while sharing information across groups. | Available in the open-source fuser package. |
| Preprocessed Microbiome Datasets [18] | Standardized, curated datasets used for benchmarking algorithm performance and hyperparameter tuning across different ecological niches. | Examples: HMPv35, MovingPictures, TwinsUK (see Table 1). |
| Same-All Cross-Validation (SAC) Framework [18] | A rigorous validation protocol for evaluating and tuning network inference algorithms for their ability to generalize within and across environmental niches. | Custom implementation based on the described two-regime (Same/All) procedure. |
Addressing Higher-Order Interactions and Sampling Resolution Limitations
In microbiome research, network inference is a powerful tool for moving beyond taxonomic composition to understand the complex web of interactions between microorganisms. However, two significant methodological challenges persist: accounting for higher-order interactions beyond simple pairwise correlations, and overcoming sampling resolution limitations inherent in longitudinal studies [3]. Higher-order interactions occur when the relationship between two taxa is conditional upon a third, creating complex dependencies that traditional correlation networks fail to capture [44]. Simultaneously, sparse sampling across time points often limits our ability to observe true temporal dynamics in microbial communities [3]. This protocol presents integrated computational frameworks to address both challenges, enabling more accurate inference of microbial ecological relationships.
Theoretical Background
Characteristics of Microbiome Data Affecting Network Inference
Microbiome data derived from high-throughput sequencing exhibits several intrinsic properties that complicate network inference and must be addressed methodologically [44] [62]:
- Compositionality: Data represent relative abundances rather than absolute counts, creating false negative correlations [62]
- High Dimensionality: Number of taxa (p) typically exceeds number of samples (n), creating the "p≫n" problem [3]
- Sparsity: Abundance matrices contain numerous zeros (often >90%), representing either true or technical zeros [44]
- Heterogeneity: Technical variation from sequencing depth and biological variation across samples [62]
Defining Higher-Order Interactions in Microbial Systems
In microbiome networks, higher-order interactions extend beyond direct pairwise relationships to include conditional dependencies where the association between two microbial taxa depends on the state of one or more additional taxa [44]. These interactions manifest as:
- Conditional independence: Relationships that appear only when controlling for other community members
- Interaction modifications: Cases where one taxum alters the interaction between two others
- Emergent properties: System-level behaviors not predictable from pairwise relationships alone
Table 1: Comparison of Network Inference Approaches for Microbiome Data
| Method Type | Key Principle | Handles Compositionality | Accounts for Higher-Order Interactions | Longitudinal Data Support |
|---|---|---|---|---|
| Correlation-based (Pearson, Spearman) | Measures pairwise association | No | No | Limited |
| Compositionally-aware (SparCC, SPIEC-EASI) | Uses log-ratio transformations | Yes | Partial (via global structure) | Limited |
| Conditional Independence (LUPINE) | Partial correlation with low-dimensional approximation | Yes | Yes (via conditioning) | Yes (sequential design) |
| Multi-omics Integration | Combines multiple data types | Varies | Yes (via cross-domain conditioning) | Developing |
Experimental Protocols
LUPINE Protocol for Longitudinal Network Inference
LUPINE addresses sampling resolution limitations by sequentially incorporating information from previous time points, making it particularly suitable for studies with limited time points [3].
Data Preprocessing Requirements
- Input Data: Raw count tables from 16S rRNA or metagenomic sequencing
- Normalization: Apply centered log-ratio (CLR) transformation to address compositionality
- Quality Control: Filter taxa with prevalence <10% across samples
- Metadata: Time points and group identifiers must be clearly specified
Core Algorithmic Workflow
The following diagram illustrates the sequential modeling approach of LUPINE:
Implementation Code
MINA Framework for Higher-Order Interaction Detection
The Microbial community diversity and Network Analysis (mina) framework addresses higher-order interactions by integrating co-occurrence networks with diversity analysis [41].
Representative ASV Selection
- Abundance-Occupancy Filtering: Rank ASVs by prevalence and relative abundance
- Procrustes Analysis: Identify ASVs contributing most to beta diversity
- Dimensionality Reduction: Typically reduces features by 40-60% while retaining 70%+ of community variation [41]
Network-Based Diversity Index
Implementation Code
Research Reagent Solutions
Table 2: Essential Computational Tools for Microbiome Network Inference
| Tool/Resource | Function | Application Context | Source |
|---|---|---|---|
| COBRA Toolbox | Constraint-based metabolic modeling | Genome-scale metabolic network inference | VMH Database |
| AGORA2 Resource | 7,302 microbial metabolic reconstructions | Mechanistic network modeling | [64] |
| APOLLO Resource | 247,092 metagenome-assembled genome reconstructions | Large-scale microbiome network analysis | [64] |
| MicroMap | Manually curated microbiome metabolic network visualization | Visual exploration of microbiome metabolism | MicroMap Dataverse |
| CellDesigner | Structured diagram editor for biochemical networks | Network visualization and annotation | CellDesigner.org |
| mina R Package | Microbial community diversity and network analysis | Higher-order interaction detection | CRAN |
| LUPINE Algorithm | Longitudinal modeling with partial least squares regression | Dynamic network inference with limited time points | [3] |
Data Analysis and Interpretation
Statistical Validation of Higher-Order Interactions
- Spectral Distance Testing: Permutation-based approach (typically 1,000 iterations) to compare network topologies [41]
- Module Preservation: Test whether clusters identified in one condition appear in another
- Differential Network Analysis: Identify specific node pairs with significantly altered interactions
Visualization of Dynamic Network Properties
For longitudinal data, animate flux visualizations to capture temporal dynamics:
Troubleshooting and Optimization
Addressing Common Computational Challenges
- Memory Limitations: For large networks (>5,000 edges), use sparse matrix representations
- Convergence Issues: With PLS regression, ensure sample size exceeds minimum threshold (n > 20)
- False Discovery Control: Apply Benjamini-Hochberg correction for multiple testing in network inference
Performance Metrics and Quality Control
Table 3: Optimization Parameters for Network Inference Methods
| Parameter | Recommended Setting | Adjustment Condition | Impact on Results |
|---|---|---|---|
| LUPINE Component Number | 1 principal component | Increase to 2-3 if n > 100 | Higher components may capture more variance but increase noise |
| SparCC Iterations | 100 (default) | Increase to 500 for sparse data | Improved accuracy of compositionally-robust correlations |
| MINA Clustering Algorithm | Affinity Propagation | Switch to Markov for larger networks | Different cluster granularity |
| Permutation Tests | 1,000 iterations | Increase to 5,000 for publication | More stable p-value estimates |
| Edge Threshold | p < 0.01 FDR-corrected | Relax to p < 0.05 for exploratory analysis | Balance between network density and false positives |
This protocol presents integrated solutions for two fundamental challenges in microbiome network inference. For higher-order interactions, the MINA framework combined with spectral distance testing provides robust detection of complex microbial dependencies beyond pairwise correlations. For sampling resolution limitations, LUPINE's sequential approach enables dynamic network inference even with limited time points. Together, these methods advance the ecological interpretation of microbiome data by capturing the true complexity of microbial community interactions. Implementation requires careful attention to the compositional nature of microbiome data and appropriate statistical validation, but provides powerful insights into the dynamics of microbial ecosystems relevant to both basic research and therapeutic development.
Benchmarking Truth: Validation Frameworks and Algorithm Comparison
Inferring accurate ecological interaction networks from microbiome data is a cornerstone of systems biology, crucial for understanding host health, disease pathogenesis, and developing therapeutic interventions [22]. However, a fundamental challenge persists: the absence of a fully known, gold-standard network for real microbial communities against which to benchmark inference algorithms [22] [39]. This "ground truth" problem limits our ability to validate the complex web of predicted microbial interactions, such as competition, mutualism, and parasitism, and to assess the performance of different inference methods [22]. Without such validation, the biological interpretations drawn from these networks and their subsequent translation into clinical or environmental applications remain uncertain.
The complexity of microbial ecosystems, combined with the unique characteristics of microbiome sequencing data—such as compositionality, sparsity, and high dimensionality—exacerbates this challenge [22] [39]. Consequently, the field requires robust, creative methodological frameworks for training and testing co-occurrence network inference algorithms in the absence of perfect validation data. This Application Note details established and emerging protocols designed to address this critical gap, providing researchers with practical tools for rigorous network evaluation.
Quantitative Landscape of Inference Algorithms and Validation Methods
The performance of network inference algorithms is typically quantified using metrics that compare predicted interactions to a known reference or that assess predictive stability across data perturbations. Table 1 summarizes the primary categories of inference algorithms and their characteristic outputs, while Table 2 compares the prevailing methods for evaluating these inferred networks.
Table 1: Categories of Microbial Co-occurrence Network Inference Algorithms
| Algorithm Category | Representative Tools | Underlying Methodology | Network Type Inferred |
|---|---|---|---|
| Correlation-based | SparCC [39], MENAP [39] | Estimates pairwise correlations (Pearson/Spearman) from transformed abundance data. | Undirected, signed, weighted |
| Regularized Regression | CCLasso [39], REBACCA [39] | Employs L1 regularization (LASSO) on log-ratio transformed data to infer interactions. | Directed, signed, weighted |
| Graphical Models | SPIEC-EASI [39], MAGMA [39] | Uses penalized maximum likelihood to estimate the conditional dependence structure (precision matrix). | Directed, signed, weighted |
| Mutual Information | ARACNE [39], CoNet [39] | Measures both linear and non-linear dependencies between taxa using information theory. | Undirected, weighted |
| Bayesian Dynamical Systems | MDSINE2 [19] | Learns directed interaction networks and modules from timeseries data using a fully Bayesian gLV model. | Directed, signed, weighted |
Table 2: Methods for Evaluating Inferred Microbial Networks
| Evaluation Method | Core Principle | Key Metric(s) | Notable Tools/Applications |
|---|---|---|---|
| Cross-validation | Assesses an algorithm's ability to predict held-out data, providing a measure of generalizability. | Root-Mean-Squared Error (RMSE) of predicted vs. observed abundances [19]. | Novel cross-validation for hyperparameter tuning and algorithm comparison [39]. |
| Network Consistency | Evaluates the stability and robustness of an inferred network across different data subsamples. | Edge consistency, network similarity scores. | Applied in various algorithmic evaluations [39]. |
| Synthetic Data Benchmarking | Tests algorithms on simulated microbial communities where the true interaction network is known. | Precision, Recall, F1-score. | Used for foundational validation of inference methods [39]. |
| External Data Validation | Compares inferred networks with known biological interactions from external databases or literature. | Overlap with curated interactions. | Used by SparCC, SPIEC-EASI; limited by scarce ground-truth data [39]. |
Experimental Protocols for Network Validation
Protocol: Cross-Validation for Algorithm Training and Testing
This protocol outlines a novel cross-validation method designed to overcome the limitations of external validation and network consistency analysis, particularly for high-dimensional and sparse microbiome data [39].
- Primary Application: Hyper-parameter selection (training) and comparing the quality of networks from different algorithms (testing).
- Experimental Input: An ( N \times D ) count matrix of microbial abundances, where ( N ) is the number of samples and ( D ) is the number of taxa.
- Procedure:
- Data Partitioning: Randomly partition the ( N ) samples into ( k ) distinct folds (e.g., ( k=5 ) or ( k=10 )).
- Iterative Training and Prediction: For each iteration ( i = 1 ) to ( k ):
- Designate fold ( i ) as the test set and the remaining ( k-1 ) folds as the training set.
- Train the network inference algorithm on the training set. If the algorithm has hyperparameters (e.g., LASSO's regularization parameter), use nested cross-validation on the training set to select the optimal value.
- Using the trained model, predict the microbial abundances in the test set based on the inferred network structure.
- Performance Calculation: Calculate the root-mean-squared error (RMSE) between the predicted and observed log-abundances across all held-out test samples.
- Model Selection & Evaluation: For algorithm training, select the hyperparameter set that minimizes the average RMSE across all ( k ) folds. For algorithm testing, compare the average RMSE of different algorithms, where a lower score indicates better predictive performance and a more reliable network [39].
Protocol: Forecasting Microbial Dynamics for Benchmarking
This protocol uses a one-subject/hold-out approach to benchmark dynamical systems models, such as MDSINE2, which are capable of forecasting future microbial states [19].
- Primary Application: Benchmarking the predictive accuracy of dynamical systems inference methods (e.g., MDSINE2, gLV-L2) on real longitudinal data.
- Experimental Input: High-temporal-resolution longitudinal microbiome data from multiple subjects (e.g., mice or human patients), including relative abundances and total bacterial concentrations [19].
- Procedure:
- Subject Hold-Out: Designate all data from one subject as the test set and use data from all other subjects as the training set.
- Model Training: Train the dynamical model (e.g., MDSINE2) on the training set. This involves learning microbial interaction parameters, growth rates, and responses to perturbations.
- Forecasting: Using the trained model, forecast the complete trajectory of all taxa for the held-out subject. The forecast uses only the measured microbial abundances from the first timepoint of the held-out subject as the initial condition.
- Performance Quantification: Calculate the RMSE of log abundances between the model's forecast and the ground-truth measurements for the entire timeseries of the held-out subject (excluding the first timepoint). Repeat this process, holding out a different subject each time, and report the average RMSE across all subjects [19].
Visualization of Validation Workflows
The following diagram illustrates the logical structure and data flow of the key validation protocols described in this document.
The Scientist's Toolkit: Essential Research Reagents and Materials
Table 3: Key Reagents and Materials for Microbiome Dynamical Inference Studies
| Item Name | Function/Application | Example/Specification |
|---|---|---|
| 16S rRNA Gene Primers | Amplification of target bacterial genomic regions for high-throughput sequencing. | Universal primers (e.g., 515F/806R) for the V4 hypervariable region [19]. |
| Reference Databases | Taxonomic classification of sequenced amplicon sequence variants (ASVs). | Green Genes Database [39], Ribosomal Database Project (RDP) [39]. |
| qPCR Reagents (Universal 16S rDNA) | Quantification of total bacterial concentration per sample, essential for absolute abundance modeling in gLV. | SYBR Green or TaqMan chemistry with universal bacterial primers [19]. |
| Bioinformatic Processing Pipeline | Processing raw sequencing reads into high-quality ASV tables for dynamical inference. | DADA2 for quality filtering, denoising, and ASV inference [19]. |
| Bayesian Dynamical Modeling Software | Inference of directed, signed interaction networks and modules from timeseries data. | MDSINE2 open-source software package [19]. |
| Network Inference & Validation Suites | Inference of co-occurrence networks and implementation of validation protocols (e.g., cross-validation). | SPIEC-EASI [39], CCLasso [39], and custom cross-validation scripts [39]. |
Microbiomes are complex ecosystems of interdependent microorganisms, including bacteria, fungi, viruses, and archaea, which engage in intricate inter- and intra-kingdom interactions [2] [17]. Understanding these interactions is crucial for advancing human health, environmental science, and therapeutic development. Microbiome network inference has emerged as a powerful computational approach to decipher these complex interaction patterns from profiling data, revealing key taxa and functional units critical to ecosystem stability and function [17]. These networks represent microbial associations where nodes represent taxa and edges represent significant statistical associations, which can be positive or negative, weighted or unweighted [17].
The analysis of microbiome data presents substantial statistical challenges due to its inherent compositional nature, sparsity (high proportion of zeros), and over-dispersion [17] [65] [3]. These characteristics significantly impact the performance of computational methods and necessitate specialized statistical approaches. Synthetic data has therefore become an indispensable tool for validating computational methods in microbiome research, as it provides known ground truth for benchmarking algorithm performance under controlled conditions [65]. By generating synthetic data that mimics experimental data templates, researchers can systematically evaluate analytical methods, test hypotheses, and establish performance benchmarks while avoiding the limitations and costs associated with purely experimental approaches [65] [66].
Methods for Microbiome Network Inference
Microbiome network inference methods range from simple correlation-based approaches to complex conditional dependence-based methods [2] [17]. Each method offers different advantages and limitations in terms of efficiency, accuracy, speed, and computational requirements.
Table 1: Microbiome Network Inference Methods
| Method Type | Examples | Key Features | Limitations |
|---|---|---|---|
| Correlation-based | Pearson, Spearman | Simple, fast implementation | Prone to spurious correlations from compositionality [17] [3] |
| Compositionally-aware | SparCC | Accounts for compositional nature of data | Limited to single time-point analysis [3] |
| Conditional Independence-based | SpiecEasi | Uses partial correlations to detect direct associations | Computationally intensive [3] |
| Longitudinal | LUPINE | Incorporates information from previous time points | Requires longitudinal data design [3] |
More recent advancements include LUPINE (LongitUdinal modelling with Partial least squares regression for NEtwork inference), a novel approach that leverages conditional independence and low-dimensional data representation to handle scenarios with small sample sizes and limited time points [3]. LUPINE represents a significant methodological innovation as it can infer microbial networks across time while considering information from all past time points, enabling capture of dynamic microbial interactions that evolve over time [3].
Synthetic Data Generation Protocols
Simulation Tools and Their Applications
Synthetic data generation for microbiome studies employs specialized computational tools that simulate microbial abundance profiles while preserving key characteristics of experimental data.
Table 2: Synthetic Data Generation Tools for Microbiome Research
| Tool | Underlying Methodology | Key Features | Application Context |
|---|---|---|---|
| metaSPARSim [65] | Statistical model based on distribution parameters | Calibrates parameters using experimental data templates; models sparsity | 16S rRNA sequencing data simulation |
| sparseDOSSA2 [65] [66] | Bayesian model with sparse correlations | Captures feature correlations and microbial associations | Template-based synthetic community generation |
| MB-GAN [65] | Generative Adversarial Networks | Captures complex patterns and interactions present in experimental data | Complex community modeling with non-linear relationships |
Benchmark Validation Protocol
A rigorous protocol for validating synthetic data benchmarks involves multiple stages to ensure the synthetic data adequately represents experimental conditions [65] [66]:
Data Simulation: Synthetic data generation using tools like metaSPARSim or sparseDOSSA2, calibrated against experimental 16S rRNA dataset templates.
Characterization: Comprehensive evaluation of synthetic data against experimental templates using equivalence tests on multiple data characteristics (DCs), including sparsity patterns, compositionality, and variability structure.
Method Application: Application of differential abundance (DA) tests or network inference methods to both synthetic and experimental datasets.
Validation Analysis: Assessment of consistency in significant feature identification and proportion of significant features between synthetic and experimental data results.
Exploratory Analysis: Investigation of how differences between synthetic and experimental DCs may affect analytical results using correlation analysis, multiple regression, and decision trees.
Experimental Protocols for Network Inference
LUPINE Protocol for Longitudinal Network Inference
The LUPINE methodology provides a framework for inferring microbial networks from longitudinal microbiome data, addressing the dynamic nature of microbial interactions [3]. The protocol involves three distinct modeling approaches:
4.1.1 Single Time Point Modeling with PCA This approach provides insights into microbial associations at a single time point and is suitable when analyzing specific time points of interest [3]:
Partial Correlation Estimation: For a pair of taxa (i, j), estimate partial correlation while controlling for other taxa.
Dimensionality Reduction: Calculate a one-dimensional approximation of control variables (all taxa except i and j) using the first principal component to address high-dimensionality challenges.
Network Construction: Apply the above process to all taxon pairs to construct the association network.
4.1.2 Longitudinal Modeling with PLS Regression For longitudinal studies with multiple time points, LUPINE incorporates temporal dependencies [3]:
Two Time Point Modeling: Use Projection to Latent Structures (PLS) regression to maximize covariance between current and preceding time point datasets.
Multiple Time Point Modeling: Apply generalized PLS for multiple blocks of data (blockPLS) to maximize covariance between current and any past time point datasets.
Sequential Network Inference: Iteratively infer networks at each time point while incorporating information from previous time points.
Network Analysis and Interpretation
Once microbial networks are inferred, several topological and ecological parameters are used to describe and analyze the overall structure of the microbial community [17]:
- Degree: The number of correlations a node has with other nodes in the network.
- Betweenness: The number of shortest paths between each pair of nodes that pass through a given node.
- Closeness: The reciprocal of the sum of distances from a given node to all other reachable nodes.
Key network features include hub nodes (highly connected nodes), keystone nodes (nodes critical to network connectivity), and network modules (groups of highly interconnected taxa) [17]. Ecological parameters such as modularity (compartmentalization of taxa into modules) and the ratio of negative to positive interactions provide insights into community stability, with higher modularity generally associated with more stable communities [17].
The Scientist's Toolkit: Research Reagent Solutions
Table 3: Essential Research Reagents and Computational Tools
| Tool/Reagent | Type | Function/Application | Implementation |
|---|---|---|---|
| 16S rRNA Sequencing [17] | Wet-lab Technique | Taxonomic profiling of bacterial communities | Amplification and sequencing of 16S rRNA gene |
| Shotgun Metagenomics [17] | Wet-lab Technique | Comprehensive community profiling including functional potential | Whole-genome sequencing of community DNA |
| SparCC [3] | Computational Tool | Correlation-based network inference accounting for compositionality | Python implementation |
| SpiecEasi [3] | Computational Tool | Conditional independence-based network inference | R package |
| LUPINE [3] | Computational Tool | Longitudinal network inference using PLS regression | R code publicly available |
| metaSPARSim [65] | Computational Tool | Synthetic data generation for 16S sequencing data | R package |
| sparseDOSSA2 [65] [66] | Computational Tool | Bayesian synthetic data generation with sparse correlations | R package |
Applications in Drug Development and Therapeutics
Synthetic data benchmarks and network inference methods have significant implications for drug development and therapeutic interventions. By providing controlled testing environments, these approaches enable:
Identification of Therapeutic Targets: Network analysis can identify keystone taxa and hub nodes that represent potential targets for therapeutic intervention in diseases associated with microbial dysbiosis [17].
Drug Microbiome Interaction Screening: Synthetic data allows for pre-clinical screening of how drug candidates might affect microbial communities before expensive clinical trials.
Personalized Medicine Applications: Longitudinal network inference can track how individual microbiomes respond to interventions over time, enabling personalized treatment approaches.
Microbiome-Based Diagnostic Development: Validated network inference methods can identify stable microbial signatures associated with disease states for diagnostic development.
The integration of synthetic data benchmarks with network inference methodologies represents a powerful paradigm for advancing microbiome research with direct applications in pharmaceutical development and clinical medicine.
The inference of microbial interaction networks from high-throughput sequencing data is a cornerstone of modern microbiome research, enabling scientists to hypothesize about complex ecological interactions such as mutualism, competition, and antagonism [29]. The biological interpretations and subsequent hypotheses generated from these networks are heavily influenced by the choice of inference algorithm and its configuration, making the validation of these networks paramount [29]. Traditional validation methods, which rely on external data or network consistency across sub-samples, are often hampered by the scarcity of validated microbial interactions and the inherent variability of microbiome data [29]. This protocol articulates the emerging standard of using cross-validation (CV) frameworks to address two critical challenges in microbiome network inference: the selection of hyperparameters that determine network sparsity during the training phase, and the comparative evaluation of the stability and quality of inferred networks from different algorithms during the testing phase [29]. We detail the application of novel CV frameworks, including a recently proposed method for co-occurrence network inference [29] and the Same-All Cross-validation (SAC) for grouped samples [18], providing a rigorous methodology to enhance the reliability and ecological relevance of inferred microbial networks.
Background and Theoretical Foundation
Microbiome data, typically derived from 16S rRNA gene amplicon or shotgun metagenomic sequencing, presents unique analytical challenges. The data is compositional, meaning that the measured abundances are relative rather than absolute, and it is characterized by high dimensionality (many more microbial taxa than samples) and sparsity (a high percentage of zero counts) [29] [9]. These properties violate the assumptions of many traditional statistical methods and can lead to spurious correlations if not properly accounted for [9].
Co-occurrence network inference algorithms can be broadly categorized into several groups, each with its own hyperparameters that control the sparsity and density of the inferred network [29]. Table 1 summarizes the primary categories and their key characteristics. The hyperparameters within these algorithms, such as the regularization strength in LASSO or the correlation threshold in correlation-based methods, directly govern the number of edges in the network. Uninformed selection of these parameters can result in networks that are either too dense (including many false positive interactions) or too sparse (missing true ecological relationships), underscoring the need for a robust, data-driven selection process [29].
Table 1: Categories of Microbial Network Inference Algorithms and Their Hyperparameters
| Category | Notable Methods | Key Hyperparameters | Primary Function of Hyperparameters |
|---|---|---|---|
| Correlation-based | SparCC [29], MENAP [29], CoNet [29] | Correlation threshold, p-value cutoff | Determines the minimum strength and significance for an edge to be included. |
| LASSO-based | CCLasso [29], SPIEC-EASI [29], REBACCA [29] | Regularization parameter (λ) | Controls the sparsity of the network by penalizing the number of edges. |
| Graphical Models | SPIEC-EASI [29], gCoda [29], mLDM [29] | Regularization parameter (λ) | Controls the sparsity of the conditional dependence network (precision matrix). |
| Dynamic Models | BEEM-Static [67], LUPINE [12] | Equilibrium threshold, statistical filters | Identifies samples at equilibrium and filters out those violating model assumptions. |
The core principle of using cross-validation in this context is to assess how well an inferred network model generalizes to unseen data. A hyperparameter set that produces a network which accurately predicts the abundances of taxa in independent test data is considered more reliable and ecologically plausible [29]. The recent advent of compositionally-aware CV frameworks now allows researchers to tune their models effectively despite the constraints of compositional data [29].
Cross-Validation Frameworks for Microbiome Networks
Standard k-Fold Cross-Validation for Hyperparameter Tuning
The foundational CV method for hyperparameter tuning involves partitioning the dataset into k subsets (or "folds") of approximately equal size [18]. The model is trained on k-1 folds and its predictive performance is evaluated on the held-out fold. This process is repeated k times, with each fold serving as the test set once. The performance across all k iterations is averaged to produce a robust estimate of the model's generalizability.
- Workflow: The standard workflow for k-fold CV in network inference is as follows:
- Preprocessing: Log-transform the raw OTU or species count data (e.g., log10(x + 1)) to stabilize variance [18].
- Fold Generation: Randomly split the preprocessed sample-by-taxa matrix into k folds (typically k=5 or 10).
- Hyperparameter Grid: Define a grid of potential hyperparameter values (e.g., a range of λ values for LASSO).
- Iterative Training & Validation: For each hyperparameter value, perform the k-fold training and testing cycle. The loss function, often the predictive error on the held-out taxa, is recorded for each fold [29].
- Parameter Selection: Select the hyperparameter value that minimizes the average loss across all folds.
- Final Model Training: Re-train the model on the entire dataset using the selected optimal hyperparameter to infer the final network.
This process is visualized in the following workflow diagram.
The Same-All Cross-Validation (SAC) Framework for Grouped Samples
A significant limitation of standard k-fold CV arises when datasets contain structured groups, such as samples from different body sites, time points, or geographic locations. The SAC framework, a constrained variant of the SOAK CV, is specifically designed for such "grouped-sample" microbiome datasets [18]. It evaluates algorithm performance in two distinct but complementary scenarios:
- The "Same" Scenario: Training and testing the model within samples from the same environmental niche or experimental group. This assesses how well an algorithm captures associations within a homogeneous habitat.
- The "All" Scenario: Training the model on a pooled dataset containing samples from multiple niches and testing it on held-out samples from all niches. This evaluates an algorithm's ability to generalize across heterogeneous environments.
The SAC framework is particularly useful for benchmarking algorithms like fuser, a novel method based on the fused LASSO that shares information across environments during training while still generating distinct, environment-specific networks [18]. Benchmarks have shown that fuser performs comparably to standard LASSO (e.g., glmnet) in "Same" scenarios but achieves lower test error and better generalizability in "All" cross-environment scenarios [18].
Detailed Experimental Protocols
Protocol 1: Hyperparameter Tuning for a Single Dataset
This protocol details the application of k-fold CV to tune the regularization parameter (λ) for a LASSO-based network inference algorithm using a single, non-grouped microbiome dataset.
Table 2: Research Reagent Solutions for Protocol 1
| Item | Function/Description | Example/Note |
|---|---|---|
| Microbiome Abundance Matrix | The primary input data (samples x taxa). | Raw OTU or ASV counts from 16S rRNA sequencing, or species counts from metagenomics. |
| Computing Environment | Software platform for statistical computing and analysis. | R (version 4.1.0 or higher) or Python (version 3.8 or higher). |
| Network Inference Package | Software implementation of the chosen algorithm. | R packages such as SPIEC.EASI [29] or glmnet [29] [67]. |
| Cross-Validation Package | Tool to orchestrate the k-fold CV process. | R packages such as caret or custom scripts using cv.glmnet. |
Step-by-Step Procedure:
Data Preprocessing:
- Input: Raw count matrix.
- Transformation: Apply a log10 transformation with a pseudocount:
log10(x + 1)[18]. This stabilizes variance and reduces the influence of highly abundant taxa. - Filtering: Remove low-prevalence taxa to reduce noise. A common threshold is to retain only taxa present in at least 5% of samples [18] [68].
- Output: A filtered, log-transformed abundance matrix ready for analysis.
Configuration of Cross-Validation:
- Set the number of folds, k. A value of 5 or 10 is standard.
- Define a sequence of 100 or more λ values across a reasonable range (e.g., from a value that produces a null model to a value that produces a very dense model). Most software packages can generate this sequence automatically.
Execution of k-Fold CV:
- For each λ in the sequence, the model is subjected to k-fold CV.
- In each fold, the model is trained on the training set. For LASSO, this involves solving a regularized linear regression problem for each taxon, where the abundance of the taxon is predicted by the abundances of all other taxa.
- The predictive performance for that fold is measured, typically using mean squared error on the held-out test data.
- The average performance metric across all k folds is computed for the current λ.
Selection of Optimal Hyperparameter:
- Identify the λ value that minimizes the average cross-validation error. This value, denoted λ*, represents the optimal trade-off between model complexity and predictive accuracy.
- Some implementations use the "one-standard-error" rule, which selects the most parsimonious model whose error is within one standard error of the minimum, further encouraging sparsity.
Inference of the Final Network:
- Re-train the network inference algorithm on the entire preprocessed dataset using the selected optimal hyperparameter λ*.
- The non-zero coefficients in the resulting model define the edges of the microbial co-occurrence network.
Protocol 2: Evaluating Network Stability and Comparing Algorithms
This protocol employs cross-validation to assess the stability of an inferred network and to compare the quality of networks produced by different algorithms, a process critical for testing and benchmarking [29].
Step-by-Step Procedure:
Data Preparation and Splitting:
- Preprocess the data as described in Protocol 1, Step 1.
- Split the entire dataset into multiple training and testing sets (e.g., using k-fold splitting without a hyperparameter grid).
Network Inference on Training Sets:
- For each algorithm to be compared (e.g., a correlation-based method, a LASSO method, and a GGM method), infer a network on each training set.
- Crucially, each algorithm must use its own optimally tuned hyperparameters, determined via a nested CV on the training set alone to avoid bias.
Evaluation on Test Sets:
- The quality of each network inferred from a training set is evaluated by its predictive accuracy on the corresponding held-out test set. The novel CV method proposed by Agyapong et al. demonstrates that this predictive performance is a reliable proxy for network quality [29].
- The predictive accuracy is measured by how well the model, defined by the inferred network, predicts the abundances of taxa in the test data.
Stability and Quality Assessment:
- Stability: Calculate the consistency of edges across networks inferred from different training folds. A stable algorithm will produce networks with a high Jaccard similarity or edge overlap between folds.
- Comparative Quality: Compare the average predictive accuracy of the different algorithms across all test folds. The algorithm with the highest and most consistent predictive accuracy is considered to produce the highest quality networks. Empirical studies using this approach have shown, for instance, that compositionally-aware methods like
SPIEC-EASIoften yield more reliable networks than simple correlation methods [29] [9].
The following diagram illustrates the logical relationship between the tuning and testing phases, highlighting how they feed into the final validated network.
Application Notes and Troubleshooting
- Handling Compositional Data: The CV frameworks described here are designed to be used with algorithms that themselves account for data compositionality (e.g., through log-ratio transformations [29]). Ensure your chosen algorithm is compositionally robust.
- Computational Demand: Network inference and CV are computationally intensive, especially for datasets with thousands of taxa. Consider using high-performance computing clusters and optimizing code. The sparsity-inducing nature of LASSO helps mitigate this.
- Sparsity and Zero-Inflation: If data sparsity is very high, the log-transformation may be unstable. Exploratory data analysis to understand the level of sparsity is recommended before beginning network inference. Methods like BEEM-Static employ statistical filters to automatically identify and remove samples that violate model assumptions, such as those not at equilibrium [67].
- Benchmarking in Your Domain: When applying these protocols to a new area of microbiome research (e.g., soil vs. human gut), it is advisable to run a small-scale benchmarking study using the SAC framework to identify the algorithm that generalizes best for your specific environmental context [18].
The adoption of rigorous cross-validation frameworks is becoming an indispensable standard for validating microbial network inference. The protocols outlined here for hyperparameter tuning and network stability testing provide a systematic approach to move beyond ad-hoc parameter selection and qualitative comparisons. By implementing these standards, researchers can generate more reliable, stable, and ecologically interpretable microbial interaction networks, thereby strengthening the foundation for subsequent hypotheses in microbial ecology, drug development, and personalized medicine.
Inferring microbial interaction networks from sequencing data is a fundamental task in microbiome research, with direct implications for understanding health, disease, and therapeutic development. The comparative evaluation of computational methods for this task hinges on specific performance metrics, primarily precision and recall, as well as the accurate recovery of underlying network properties. High precision ensures that inferred interactions are real and not spurious, minimizing false leads in downstream experimental validation. High recall ensures that a method can capture a comprehensive set of true biological interactions, providing a complete picture of the microbial community. Beyond these standard metrics, the ability of a method to correctly recover the true topology of the network—such as its connectivity, modularity, and interaction strengths—is critical for generating biologically meaningful and actionable hypotheses. This application note synthesizes recent benchmarking studies to provide a clear comparison of leading network inference methods and detailed protocols for their application and evaluation.
Performance Benchmarking of Inference Methods
Independent benchmarking studies, utilizing both simulated and real microbiome data, have evaluated the performance of various network inference methods. The results highlight a trade-off between precision and recall that varies by method, and demonstrate that newer approaches often outperform established ones in specific tasks like forecasting or differential abundance detection.
Table 1: Performance Metrics of Network Inference and Differential Abundance Methods
| Method | Key Feature | Reported Performance (Metric) | Benchmark Context |
|---|---|---|---|
| LUPINE [3] | Longitudinal inference using PLS regression | N/A (Validated on case studies) | Robustness in small-sample, multi-time-point scenarios [3] |
| MDSINE2 [19] | Bayesian dynamical systems with interaction modules | Forecasting RMSE: ~2.5-4.5 (log abundance) [19] | Outperformed gLV-L2 and gLV-net on real murine data [19] |
| Network-based DAA (Makarsa) [69] | Differential abundance via network proximity | F1 Score: Superior to ANCOM-BC/BC2 [69] | Simulation from five empirical datasets [69] |
| CORNETO [70] | Multi-sample inference with prior knowledge | N/A (Provides sparser, more interpretable solutions) [70] | Unified framework for signaling and metabolic networks [70] |
A core challenge in benchmarking is the lack of a definitive ground truth for real microbiome data. Studies therefore rely on simulated data with known network structures to compute precision and recall directly, or use held-out forecasting on longitudinal data as a proxy for performance, measured by metrics like Root-Mean-Squared Error (RMSE) [19]. For example, MDSINE2 demonstrated superior forecasting accuracy (lower RMSE) compared to generalized Lotka-Volterra (gLV) methods with ridge or elastic net regularization on high-temporal-resolution data from humanized mice [19].
In differential abundance analysis (DAA), a novel network-based approach implemented in the Makarsa plugin for QIIME 2 has shown consistently higher F1 scores (the harmonic mean of precision and recall) compared to established methods like ANCOM-BC and ANCOM-BC2 in simulations based on multiple empirical datasets [69]. This method identifies differentially abundant features based on their network proximity to a metadata state (e.g., a disease condition) within a probabilistic graph inferred by FlashWeave, which accounts for compositionality and sparsity [69].
Experimental Protocols for Performance Evaluation
Protocol 1: Benchmarking with Simulated Data
This protocol outlines the steps for a robust comparative evaluation of network inference methods using simulated data, where the true network is known.
1. Data Simulation:
- Input: A real microbiome abundance table (e.g., from a healthy human gut) to serve as a biologically realistic template.
- Tool: Use a third-party simulator like
SimulateMSeq[69] or a dedicated dynamical simulator. The simulator should be independent of the inference methods being tested to avoid bias. - Action: Generate multiple simulated datasets. Introduce known, pre-defined differential abundance effects or modify interaction parameters in a known network to create a ground truth.
2. Network Inference:
- Input: The simulated abundance tables.
- Tools: Apply the network inference methods to be compared (e.g., LUPINE, MDSINE2, SparCC, SpiecEasi) [3] [19].
- Action: Run each method according to its documentation to infer microbial association networks.
3. Performance Calculation:
- Metrics: Compare the inferred network against the known ground-truth network from Step 1.
- Precision: Calculate as TP / (TP + FP), where TP is the number of correctly inferred edges, and FP is the number of incorrectly inferred edges.
- Recall (Sensitivity): Calculate as TP / (TP + FN), where FN is the number of true edges that the method failed to infer.
- F1 Score: Calculate as the harmonic mean of precision and recall: 2 * (Precision * Recall) / (Precision + Recall) [69].
Protocol 2: Forecasting on Longitudinal Data
This protocol evaluates a method's ability to predict future microbial states, which is a strong indicator of its capture of true ecological dynamics.
1. Data Preparation:
- Input: A high-temporal-resolution longitudinal microbiome dataset, ideally with introduced perturbations (e.g., antibiotic or dietary shifts) [19].
- Action: For a given subject (or mouse), hold out all data from that subject. Use the remaining subjects for training.
2. Model Training and Forecasting:
- Tools: Use a dynamical inference method like MDSINE2 [19] or the longitudinal mode of LUPINE [3].
- Action: Train the model on the data from the training subjects. Using only the first time point from the held-out subject as the initial condition, forecast the trajectories of all taxa for the entire subsequent time series.
3. Performance Calculation:
- Metric: Compute the Root-Mean-Squared Error (RMSE) between the predicted and the held-out ground-truth measurements of log abundances over the entire time series [19]. A lower RMSE indicates better forecasting performance and, by extension, a more accurate inference of the underlying dynamics.
Protocol 3: Comparing Inferred Network Properties
This protocol assesses whether an inferred network recovers key ecological properties of the microbiome, which is vital for biological interpretability.
1. Network Inference & Grouping:
- Input: Microbiome data from different conditions (e.g., healthy vs. diseased cohorts).
- Action: Infer microbial networks for each condition separately using a method of choice.
2. Network Property Calculation:
- Action: For each inferred network, calculate global and local topological properties.
- Complexity/Connectance: The proportion of possible interactions that are realized.
- Modularity: The degree to which the network is organized into distinct clusters (modules) [41].
- Average Clustering Coefficient: A measure of the degree to which nodes tend to cluster together.
- Centrality: Identification of keystone taxa (e.g., with high betweenness centrality) [19].
3. Statistical Comparison:
- Action: Use a permutation-based statistical test to determine if the differences in network properties between conditions are significant.
- Tool: Frameworks like
minaprovide methods based on spectral distances to compare networks and pinpoint the specific features driving the differences [41].
- Tool: Frameworks like
The Scientist's Toolkit: Essential Research Reagents
Table 2: Key Software and Analytical Reagents for Microbiome Network Inference
| Research Reagent | Type | Function in Analysis |
|---|---|---|
| LUPINE [3] | R Package | Infers longitudinal microbial networks using partial least squares regression, ideal for small sample sizes. |
| MDSINE2 [19] | Open-Source Software | Learns Bayesian dynamical systems models with interaction modules from timeseries data for forecasting and stability analysis. |
| CORNETO [70] | Python Library | A unified framework for multi-sample network inference from prior knowledge and omics data for signaling and metabolic networks. |
| mina [41] | R Package | Performs integrated diversity and network analyses, and provides permutation-based statistical network comparison. |
| Makarsa [69] | QIIME 2 Plugin | Performs network-based differential abundance analysis using FlashWeave for network inference. |
| FlashWeave [69] | Network Inference Algorithm | Infers probabilistic microbial interaction networks that account for compositionality and sparsity. |
| SparCC [41] | Network Inference Algorithm | Infers correlation networks from compositional data by estimating relative variances. |
| SimulateMSeq [69] | Simulation Tool | Generates biologically realistic microbiome samples with known differential abundance for benchmarking. |
| ZIEL Mock Community [71] | Reference Material | A defined mix of microbial strains used to validate sequencing protocols and bioinformatic pipelines. |
In microbiome research, inferring interaction networks from species abundance data is fundamental for understanding the ecological dynamics that influence host health and disease. However, a significant challenge persists: the multitude of available inference algorithms, when applied to the same dataset, often produce vastly different networks, raising concerns about the reliability and reproducibility of the findings [24]. This lack of consensus stems from the different mathematical assumptions each method uses to handle the unique characteristics of microbiome data, such as compositionality, sparsity, and zero-inflation [24] [72].
To address this critical issue of reproducibility, two powerful concepts have emerged: consensus networks and stability selection. Consensus network methods aim to combine the results of multiple inference algorithms into a single, more robust network, thereby mitigating the bias inherent in any single method [24] [73]. Complementarily, stability selection uses resampling techniques to identify stable, reproducible edges that are consistently selected across different subsets of the data, providing a principled approach to control false discoveries and enhance reliability [24]. This protocol details the application of these methodologies within the context of microbiome network inference, providing researchers with a structured framework to achieve more reproducible and biologically meaningful results.
Comparative Analysis of Network Inference Methodologies
The field of microbial network inference is populated by a diverse array of algorithms, which can be broadly categorized into correlation-based, conditional dependency-based, and dynamical models. Table 1 summarizes the key methods relevant to consensus building and their core characteristics.
Table 1: Key Microbiome Network Inference Methods for Consensus Building
| Method Name | Underlying Principle | Key Strength | Integration in Consensus Tools |
|---|---|---|---|
| OneNet [24] | Consensus ensemble of seven GGM-based methods | Achieves higher precision and sparsity than any single method | Native consensus framework |
| CMiNet [73] | Consensus of nine correlation and conditional dependency methods | Combines diverse approaches; includes non-linear CMIMN | Native consensus framework |
| SpiecEasi [24] [73] | Gaussian Graphical Models (MB/Glasso) | Accounts for compositionality; uses StARS for stability | Included in OneNet and CMiNet |
| SPRING [24] [73] | Semi-parametric rank-based partial correlation | Handles zero-inflated, quantitative data | Included in OneNet and CMiNet |
| gCoda [24] | Gaussian Graphical Models for compositional data | Specifically designed for compositional bias | Included in OneNet |
| PLNnetwork [24] | Poisson Lognormal models | Handles count-based over-dispersed data | Included in OneNet |
| SparCC [73] | Correlation for compositional data | Estimates correlations from log-ratios | Included in CMiNet |
| CCLasso [73] | Lasso for compositional data | Infers sparse correlations with regularization | Included in CMiNet |
| LUPINE [3] | Partial Least Squares regression | Designed for longitudinal data analysis | Specialized for temporal data |
| MDSINE2 [19] | Generalized Lotka-Volterra dynamics | Models temporal dynamics and perturbations | Specialized for time-series inference |
For researchers, the choice of methods to include in a consensus depends on the data type and research question. For standard cross-sectional abundance data, tools like OneNet and CMiNet offer pre-configured consensus pipelines. For longitudinal studies, LUPINE or MDSINE2 are more appropriate, though they operate outside the current consensus frameworks that focus on cross-sectional methods [3] [19].
Consensus Network Inference with OneNet
The OneNet package provides a robust, multi-step protocol for inferring a consensus network from microbiome abundance data by leveraging stability selection across multiple algorithms [24].
Experimental Principles and Objectives
The primary objective is to infer a sparse, reproducible microbial interaction network where edges represent robust conditional dependencies between microbial taxa. OneNet integrates seven distinct Gaussian Graphical Model (GGM)-based methods—Magma, SpiecEasi, gCoda, PLNnetwork, EMtree, SPRING, and ZiLN—to create a unified consensus network. The core principle is that edges consistently identified by multiple methods and across data subsamples are more likely to represent true biological interactions rather than methodological artifacts [24].
Reagent and Software Solutions
Table 2: Essential Research Reagents and Software for OneNet
| Item Name | Function/Description | Usage in Protocol |
|---|---|---|
| R Statistical Software | Programming environment for statistical computing | Core platform for running the OneNet package and analyses |
| OneNet R Package | Implements the consensus network inference pipeline | Primary tool for network inference (https://github.com/metagenopolis/OneNet) |
| Microbiome Abundance Matrix | Input data (samples x taxa) of microbial counts or proportions | Raw material for network inference; requires pre-processing |
| Stability Selection Framework | Resampling procedure to assess edge reproducibility | Tunes regularization and combines edge frequencies |
OneNet Step-by-Step Protocol
The workflow of the OneNet method is visually summarized in the diagram below.
Procedure:
Bootstrap Resampling: From the original
n x pabundance matrix (withnsamples andptaxa), generateBbootstrap subsamples by randomly selecting subsets of rows (samples) with replacement. A typical value forBis 20 to 100 [24].Multi-Method Network Inference: Apply each of the seven integrated GGM-based inference methods (e.g., SpiecEasi, gCoda) to every bootstrap subsample. For each method and subsample, this generates a network solution path across a pre-defined grid of regularization parameters (
λ). The output for each edge is a selection frequency or a probability score.Compute Edge Selection Frequencies: For each method and for each value of
λ, calculate the edge selection frequencyf(λ)as the proportion of bootstrap subsamples in which that edge is included in the network.Harmonize Network Density: A critical step in OneNet is to select a different
λvalue for each method to achieve a common target density across all methods. This ensures that all methods contribute equally to the consensus, preventing methods that infer denser networks from dominating the result. The StARS (Stability Approach to Regularization Selection) criterion is typically used for this purpose [24].Build the Consensus Network: For each edge, summarize its selection frequency across all methods. A threshold is then applied to these combined frequencies (e.g., an edge is included if its consensus frequency is above a predefined cut-off). This final set of stable, reproducible edges constitutes the consensus network.
Data Interpretation and Validation
The resulting consensus network should be evaluated for its ecological and biological plausibility. Key analyses include:
- Precision and Recall: On simulated data with known ground truth, OneNet has been shown to achieve higher precision than any single method, though it may produce slightly sparser networks [24].
- Microbial Guild Identification: Examine the network for clusters (modules) of highly interconnected taxa. In an application to liver cirrhosis data, OneNet identified a "cirrhotic cluster" of bacteria associated with degraded host health, validating the biological relevance of the inferred network [24].
- Network Topology: Calculate standard topological metrics (e.g., connectivity, clustering coefficient) to characterize the overall structure of the consensus network [72].
Alternative Protocol: Consensus with CMiNet
CMiNet offers a complementary approach to consensus network inference, integrating a different and broader set of algorithms [73].
CMiNet Step-by-Step Protocol
Algorithm Selection and Application: CMiNet incorporates ten algorithms: Pearson, Spearman, Bicor, SparCC, SpiecEasiMB, SpiecEasiGlasso, SPRING, GCoDA, CCLasso, and a novel Conditional Mutual Information method (CMIMN). The user can run all or a selected subset of these methods on their pre-processed abundance matrix.
Generate Weighted Consensus Network: For each edge, CMiNet calculates a consensus weight, which is typically the number of methods (out of
Ntotal) that identified that edge. This results in a weighted adjacency matrix for the entire network, where edge weights range from 1 toN.Threshold the Consensus Network: The user selects a score threshold
T(where1 ≤ T ≤ N) to create a final binary network. Only edges with a weight ≥Tare retained. For example, settingT = Nincludes only edges found by all methods, yielding a very sparse, high-confidence network. LoweringTincludes edges supported by fewer methods, resulting in a denser network [73].
Data Interpretation
A key advantage of CMiNet is the flexibility to explore networks at different confidence levels. The process_and_visualize_network function allows users to visualize how network connectivity (number of nodes and edges) changes with the threshold T [73]. This enables researchers to balance confidence and inclusiveness based on their research goals. The package also includes functions like plot_hamming_distances to quantify and visualize the structural differences between networks generated by the individual algorithms, highlighting the need for a consensus approach [73].
A Framework for Data Preparation and Stability Analysis
Regardless of the consensus tool chosen, careful data preparation is essential for obtaining reliable networks. Furthermore, the inferred networks can be analyzed for properties of stability, which is crucial for understanding microbiome resilience.
Data Preparation Protocol
- Taxonomic Agglomeration: Decide on the taxonomic resolution (e.g., ASVs, 97% OTUs, or genus level). Higher-level grouping reduces data dimensionality and zero-inflation but loses strain-level information [72].
- Prevalence Filtering: Filter out taxa that are present in fewer than a threshold percentage of samples (e.g., 10-20%) to reduce zero-inflation and focus on commonly occurring taxa. This represents a trade-off between inclusivity and accuracy [72].
- Compositional Data Transformation: Apply transformations like the center-log ratio (CLR) to account for the compositional nature of the data, which is crucial for avoiding spurious correlations. Tools like SpiecEasi and SparCC have built-in procedures for this [73] [72].
- Inter-kingdom Networking: When integrating data from different domains (e.g., bacteria and fungi), transform each dataset independently via CLR before concatenation to avoid introducing bias [72].
Assessing Network Stability
The concept of stability in microbiome networks refers to a community's ability to resist change or recover from disturbance. The following diagram illustrates the pathway from raw data to insights into network stability.
The stability of a consensus network can be interrogated through its topological properties [72]:
- Connectivity/Degree: The number of connections per node. The distribution of connectivity can suggest stability, though the relationship is complex and context-dependent.
- Clustering Coefficient: Measures the degree to which nodes tend to cluster together. Higher clustering may contribute to functional redundancy and stability.
- Modularity: Quantifies the extent to which the network is organized into distinct modules (guilds). High modularity is often theorized to aid stability by compartmentalizing perturbations.
The path toward reproducible microbiome network inference is paved by methodologies that explicitly address the variability and uncertainty inherent in complex biological data. The integrated use of consensus networks, which aggregate the results of multiple inference algorithms, and stability selection, which identifies robust edges through resampling, provides a statistically grounded framework to achieve this goal. Protocols for tools like OneNet and CMiNet, coupled with rigorous data preparation and stability analysis, empower researchers to move beyond single-method dependencies and generate microbial interaction networks that are more reliable, interpretable, and ultimately, more meaningful for formulating biological hypotheses in health and disease.
Conclusion
Microbiome network inference has matured into a powerful, yet complex, discipline essential for translating microbial community data into biological insight. The journey from foundational concepts to advanced validation underscores that no single method is universally superior; rather, the choice of algorithm must be guided by the data's properties and the research question. The emergence of consensus methods like OneNet and robust validation frameworks, including cross-validation, marks a critical step towards reproducible and reliable network models. Looking ahead, the integration of multi-omic data, the development of standards for incorporating network analysis into the drug discovery pipeline, and the creation of more sophisticated tools to infer directed and higher-order interactions will be pivotal. For biomedical and clinical research, robustly inferred networks offer a direct path to identifying microbial guilds and therapeutic targets, ultimately accelerating the development of microbiome-based diagnostics and interventions.
References
- 1. gCoda: Conditional Dependence Network Inference for ... [https://pmc.ncbi.nlm.nih.gov/articles/PMC5510714/]
- 2. Network analysis methods for studying microbial ... [https://www.sciencedirect.com/science/article/pii/S2001037021001823]
- 3. Microbial network inference for longitudinal microbiome ... [https://microbiomejournal.biomedcentral.com/articles/10.1186/s40168-025-02041-w]
- 4. Microbial interaction-driven community differences as ... [https://pmc.ncbi.nlm.nih.gov/articles/PMC8599104/]
- 5. Biogeographic shifts in the microbial co-occurrence network ... [https://ecologicalprocesses.springeropen.com/articles/10.1186/s13717-024-00550-4]
- 6. Predicting microbial community structure and temporal ... [https://www.nature.com/articles/s41467-025-64175-7]
- 7. DHCLHAM: microbe-drug interaction prediction based on ... [https://www.frontiersin.org/journals/microbiology/articles/10.3389/fmicb.2025.1657431/full]
- 8. DHCLHAM: microbe-drug interaction prediction based on ... [https://pmc.ncbi.nlm.nih.gov/articles/PMC12531137/]
- 9. Meta-analysis of microbiome association networks reveal ... [https://www.nature.com/articles/s41598-022-22541-1]
- 10. OneNet—One network to rule them all: Consensus ... [https://pmc.ncbi.nlm.nih.gov/articles/PMC11654977/]
- 11. 12. Styles — Cytoscape User Manual 3.10.4 documentation [https://manual.cytoscape.org/en/stable/Styles.html]
- 12. Microbial network inference for longitudinal microbiome ... [https://pubmed.ncbi.nlm.nih.gov/40033386/]
- 13. taxa as drivers of Keystone and functioning microbiome structure [https://www.nature.com/articles/s41579-018-0024-1?error=cookies_not_supported&code=4a9e46e3-34a0-4d42-aa52-d967c1d72b39]
- 14. Characterization of two keystone taxa, sulfur-oxidizing, and... [https://microbiomejournal.biomedcentral.com/articles/10.1186/s40168-023-01583-1]
- 15. Frontiers | Characteristics of putative keystones in the healthy adult... [https://www.frontiersin.org/journals/microbiology/articles/10.3389/fmicb.2024.1454634/full]
- 16. Microbial Hub Taxa Link Host and Abiotic Factors to Plant Microbiome ... [https://journals.plos.org/plosbiology/article?id=10.1371/journal.pbio.1002352]
- 17. Connect the dots: sketching out microbiome interactions ... [https://pmc.ncbi.nlm.nih.gov/articles/PMC10696587/]
- 18. 1 Introduction [https://arxiv.org/html/2509.09413]
- 19. Learning ecosystem-scale dynamics from microbiome data ... [https://www.nature.com/articles/s41564-025-02112-6]
- 20. Your Friendly Guide to Colors in Data visualization [https://lisacharlottemuth.com/2016/04/22/Colors-for-DataVis/]
- 21. Beyond just correlation: causal machine learning for the ... [https://pmc.ncbi.nlm.nih.gov/articles/PMC12521120/]
- 22. Mapping the microbial interactome: Statistical and ... [https://pmc.ncbi.nlm.nih.gov/articles/PMC6547001/]
- 23. Networks as tools for defining emergent properties of ... [https://microbiomejournal.biomedcentral.com/articles/10.1186/s40168-024-01868-z]
- 24. Consensus network inference from microbiome data [https://journals.plos.org/ploscompbiol/article?id=10.1371/journal.pcbi.1012627]
- 25. Microbial network analysis: How to unravel interactions ... [https://lizard.bio/knowledge-hub/microbial-network-analysis]
- 26. Network analyses in microbiome based on high-throughput ... [https://pmc.ncbi.nlm.nih.gov/articles/PMC7986608/]
- 27. Microbiome Multi-Omics Network Analysis: Statistical ... [https://www.frontiersin.org/journals/genetics/articles/10.3389/fgene.2019.00995/full]
- 28. Topological and spatial heterogeneity of gut microbiota co ... [https://www.frontiersin.org/journals/microbiology/articles/10.3389/fmicb.2025.1578236/full]
- 29. Cross-validation for training and testing co-occurrence ... [https://pmc.ncbi.nlm.nih.gov/articles/PMC11883995/]
- 30. Chapter 7: Correlation and Simple Linear Regression [https://courses.lumenlearning.com/suny-natural-resources-biometrics/chapter/chapter-7-correlation-and-simple-linear-regression/]
- 31. 1 Introduction [https://arxiv.org/html/2509.09413v1]
- 32. Machine Learning — Graphical Model | by Jonathan Hui [https://jonathan-hui.medium.com/machine-learning-graphical-model-b68b0c27a749]
- 33. Graphical Markov Models in Multivariate Analysis [https://www.stat.washington.edu/tsr/research/graphical.html]
- 34. A graphical framework for interpretable correlation matrix ... [https://link.springer.com/article/10.1007/s10260-025-00788-y]
- 35. Learning Gaussian graphical models from correlated data - PMC [https://pmc.ncbi.nlm.nih.gov/articles/PMC12323441/]
- 36. Difficulty in inferring microbial community structure based on co-occurrence network approaches | BMC Bioinformatics | Full Text [https://bmcbioinformatics.biomedcentral.com/articles/10.1186/s12859-019-2915-1]
- 37. Sparse and Compositionally Robust Inference of Microbial Ecological Networks | PLOS Computational Biology [https://journals.plos.org/ploscompbiol/article?id=10.1371/journal.pcbi.1004226]
- 38. HARMONIES: A Hybrid Approach for Microbiome Networks ... [https://pmc.ncbi.nlm.nih.gov/articles/PMC7283552/]
- 39. Cross-validation for training and testing co-occurrence ... [https://bmcbioinformatics.biomedcentral.com/articles/10.1186/s12859-025-06083-7]
- 40. Compositional zero-inflated network estimation for microbiome data | BMC Bioinformatics [https://link.springer.com/article/10.1186/s12859-020-03911-w]
- 41. Integrated diversity and network analyses reveal drivers of ... [https://pmc.ncbi.nlm.nih.gov/articles/PMC12542658/]
- 42. Sparse and Compositionally Robust Inference of Microbial ... [https://pmc.ncbi.nlm.nih.gov/articles/PMC4423992/]
- 43. 20 Network learning & analysis – Orchestrating Microbiome Analysis [https://microbiome.github.io/OMA/docs/devel/pages/network_learning.html]
- 44. Progress on network modeling and analysis of gut microecology [https://pmc.ncbi.nlm.nih.gov/articles/PMC11207142/]
- 45. Quantifying the intra- and inter-species ... [https://www.nature.com/articles/s41467-025-61368-y]
- 46. From variability to stability: Sensitivity of network properties ... [https://www.sciencedirect.com/science/article/pii/S2001037025001680]
- 47. Gut microbiome and its metabolites in liver cirrhosis [https://www.frontiersin.org/journals/cellular-and-infection-microbiology/articles/10.3389/fcimb.2025.1717696/full]
- 48. Gut microbiota in liver diseases: initiation, development ... [https://www.frontiersin.org/journals/medicine/articles/10.3389/fmed.2025.1615839/full]
- 49. Associations between changes in the gut microbiota and liver ... [https://bmcgastroenterol.biomedcentral.com/articles/10.1186/s12876-025-03589-5]
- 50. Pathological expansion of gut microbiome-associated ... [https://www.medrxiv.org/content/10.1101/2025.02.13.25322003v4]
- 51. The analysis of the gut microbiome during liver disease ... [https://pmc.ncbi.nlm.nih.gov/articles/PMC12481516/]
- 52. Enterotype-stratified gut microbial signatures in MASLD ... [https://pmc.ncbi.nlm.nih.gov/articles/PMC12121994/]
- 53. a review of normalization and differential abundance analysis [https://www.nature.com/articles/s41522-020-00160-w]
- 54. Analysis of Microbiome Data in the Presence of Excess Zeros [https://pmc.ncbi.nlm.nih.gov/articles/PMC5682008/]
- 55. Data pre-processing for analyzing microbiome data [https://pmc.ncbi.nlm.nih.gov/articles/PMC10569954/]
- 56. Lesson 5: Microbial diversity, alpha rarefaction, alpha diversity [https://bioinformatics.ccr.cancer.gov/docs/qiime2/Lesson5/]
- 57. Rarefaction, Alpha Diversity, and Statistics [https://www.frontiersin.org/journals/microbiology/articles/10.3389/fmicb.2019.02407/full]
- 58. Microbiome differential abundance methods produce ... [https://pmc.ncbi.nlm.nih.gov/articles/PMC8763921/]
- 59. Proportion-based normalizations outperform compositional ... [https://microbiomejournal.biomedcentral.com/articles/10.1186/s40168-023-01747-z]
- 60. Microbiome differential abundance methods produce ... [https://www.nature.com/articles/s41467-022-28034-z]
- 61. Open challenges for microbial network construction and ... [https://www.nature.com/articles/s41396-021-01027-4]
- 62. A Survey of Statistical Methods for Microbiome Data Analysis [https://www.frontiersin.org/journals/applied-mathematics-and-statistics/articles/10.3389/fams.2022.884810/full]
- 63. Methods for Improving Human Gut Microbiome Data by ... [https://journals.plos.org/plosone/article?id=10.1371/journal.pone.0134802]
- 64. The MicroMap is a network visualisation resource for ... [https://pmc.ncbi.nlm.nih.gov/articles/PMC11844556/]
- 65. Leveraging Synthetic Data to Validate a Benchmark ... | F1000Research [https://f1000research.com/articles/14-621]
- 66. Leveraging Synthetic Data to Validate a Benchmark Study ... [https://pubmed.ncbi.nlm.nih.gov/39866725/]
- 67. BEEM-Static: Accurate inference of ecological interactions ... [https://journals.plos.org/ploscompbiol/article?id=10.1371/journal.pcbi.1009343]
- 68. Machine learning-based meta-analysis reveals gut ... [https://www.nature.com/articles/s41467-025-56829-3]
- 69. Network based differential abundance analysis [https://link.springer.com/article/10.1007/s13721-025-00506-4]
- 70. Unifying multi-sample network inference from prior ... [https://www.nature.com/articles/s42256-025-01069-9]
- 71. Refining microbiome diversity analysis by concatenating ... [https://www.nature.com/articles/s41522-025-00686-x]
- 72. Networks as tools for defining emergent properties of ... [https://pmc.ncbi.nlm.nih.gov/articles/PMC11439251/]
- 73. R package for learning the Consensus Microbiome Network [https://arxiv.org/html/2411.08309v1]