Microbiome Pipeline Reproducibility: A Comprehensive Comparison of DADA2, QIIME2, and MOTHUR for Robust Biomedical Research
Reproducibility in microbiome bioinformatics is paramount for translating microbial signatures into clinical and pharmaceutical applications.
Microbiome Pipeline Reproducibility: A Comprehensive Comparison of DADA2, QIIME2, and MOTHUR for Robust Biomedical Research
Abstract
Reproducibility in microbiome bioinformatics is paramount for translating microbial signatures into clinical and pharmaceutical applications. This article provides a systematic evaluation of three widely used bioinformatics pipelines—DADA2, QIIME2, and MOTHUR—assessing their consistency in revealing microbial community structures. Drawing on recent comparative studies, we explore the foundational principles of Amplicon Sequence Variants (ASVs) and Operational Taxonomic Units (OTUs), detail best-practice methodologies, and offer troubleshooting guidance for common analytical pitfalls. A core focus is the validation of pipeline outputs, demonstrating that while relative abundance estimates may vary, robust biological conclusions on key features like Helicobacter pylori status and microbial diversity are reproducible across platforms. This resource is tailored for researchers, scientists, and drug development professionals seeking to implement reliable, reproducible, and clinically translatable microbiome analyses.
The Reproducibility Challenge: Foundational Concepts in Microbiome Bioinformatics
In microbiome research, the transition from raw genetic data to biological insight relies on complex bioinformatic pipelines. The choice of these analytical tools is not merely a technical detail but a fundamental decision that shapes research outcomes. As the field moves toward clinical and translational applications, the reproducibility of results across different computational methods has emerged as a critical concern. This guide objectively compares three widely used pipelines—DADA2, MOTHUR, and QIIME 2—by examining experimental data that benchmark their performance, providing researchers with evidence-based insights for selecting appropriate analytical frameworks.
The Reproducibility Challenge in Microbiome Analysis
Microbiome analysis presents unique reproducibility challenges due to the multi-step processing of sequencing data. Different bioinformatic approaches can introduce variability in the final microbial community profiles, potentially impacting biological interpretations. A 2025 comparative study investigating gastric mucosal microbiome composition found that although H. pylori status, microbial diversity, and relative bacterial abundance were reproducible across DADA2, MOTHUR, and QIIME 2, differences in performance were still detectable [1]. This paradox—core findings remaining stable while nuanced differences emerge—underscores the complexity of pipeline comparisons. Similarly, a 2020 evaluation of gut microbiota analyses reported that taxa assignments were consistent at both phylum and genus level across pipelines, but significant differences emerged in relative abundance estimates for most abundant genera [2]. These findings highlight that pipeline choice can simultaneously preserve broad taxonomic patterns while altering specific abundance measurements, creating a nuanced reproducibility landscape where the level of biological inference matters greatly.
Pipeline Comparison: Performance and Experimental Data
- DADA2: A package that infers amplicon sequence variants (ASVs) using a parametric error model to correct sequencing errors, providing single-nucleotide resolution [3] [4].
- MOTHUR: A comprehensive pipeline that facilitates processing sequencing data primarily through operational taxonomic unit (OTU) clustering, following a 97% similarity threshold traditionally [4].
- QIIME 2: A modular platform that can incorporate multiple analysis methods, including DADA2 for denoising, and offers extensive visualization tools and provenance tracking [5].
Comparative Performance Metrics
Table 1: Pipeline Performance Based on Mock Community Validation Studies
| Pipeline | Clustering Approach | Species-Level Accuracy | Genus-Level Accuracy | Computational Efficiency | Key Strengths |
|---|---|---|---|---|---|
| DADA2 | ASV (100% identity) | Variable across studies | High (>90%) | Moderate | Superior single-nucleotide resolution; minimal inflation of diversity [4] |
| MOTHUR | OTU (97% identity) | Moderate | High | Lower for large datasets | Extensive data preprocessing options; well-established protocols [4] |
| QIIME 2 | Flexible (ASV or OTU) | Dependent on plugins | High | Varies with plugins | User-friendly interfaces; provenance tracking; reproducible workflows [5] |
| Kraken 2 | Alignment-free k-mer | High in recent evaluations | High | Fast | Excellent species-level identification; handles large datasets efficiently [4] |
| PathoScope 2 | Bayesian reassignment | High in recent evaluations | High | Computationally intensive | Superior species-level performance; reduces false positives [4] |
Table 2: Impact of Reference Database on Taxonomic Classification Accuracy
| Reference Database | Last Update | Taxonomic Breadth | Recommended Use Cases | Compatibility |
|---|---|---|---|---|
| SILVA | 2020 (v138.1) | Comprehensive bacteria, archaea, eukaryotes | General purpose; high taxonomic resolution | All major pipelines [1] [4] |
| Greengenes | 2013 (13_8) | Bacterial and archaeal focus | Legacy comparisons; backward compatibility | QIIME 2 (default) [4] |
| RefSeq | Continuously updated | Whole genome focus | Species-level resolution; metagenomic applications | PathoScope, Kraken 2 [4] |
| RDP | Regularly maintained | Bacterial and fungal focus | Fungal analyses; ribosomal gene studies | Mothur, DADA2 [6] |
Recent benchmarking studies using mock communities with known compositions provide critical insights into pipeline performance. A 2023 comprehensive evaluation of 136 mock community samples revealed that tools designed for whole-genome metagenomics, specifically PathoScope 2 and Kraken 2, outperformed specialized 16S analysis tools (DADA2, QIIME 2, and MOTHUR) in species-level taxonomic assignment [4]. This finding challenges conventional wisdom that specialized 16S pipelines inherently provide superior performance for amplicon data. The study further identified that reference database selection significantly impacts accuracy, with SILVA and RefSeq/Kraken 2 Standard libraries outperforming the outdated Greengenes database [4].
Standardized Experimental Protocols for Pipeline Validation
Multi-Laboratory Reproducibility Assessment
A 2025 international ring trial established a robust protocol for evaluating pipeline reproducibility across five independent laboratories [7]. The experimental design incorporated:
- Standardized Ecosystems: Used fabricated ecosystem devices (EcoFAB 2.0) with the model grass Brachypodium distachyon and synthetic microbial communities (SynComs) to control biotic and abiotic factors [7].
- Controlled Variables: All laboratories received identical materials, including EcoFABs, seeds, synthetic community inoculum, and filters from a central source [7].
- Detailed Protocols: Provided comprehensive written protocols and annotated videos to minimize technical variation across sites [7].
- Centralized Analysis: Conducted all sequencing and metabolomic analyses in a single laboratory to reduce analytical variability [7].
This multi-laboratory approach demonstrated that consistent plant traits, exudate profiles, and microbiome assembly could be achieved across different research settings when standardized protocols were implemented [7].
Mock Community Benchmarking Methodology
The most rigorous approach for pipeline validation utilizes mock microbial communities with known compositions:
- Community Design: Create defined mixtures of microbial strains with staggered abundances and varying richness (e.g., 8-21 species) [4].
- Sequencing Variation: Amplify different variable regions (V3-V5) of the 16S rRNA gene using multiple primer sets and sequence across platforms (Illumina MiSeq, Ion Torrent) [4].
- Data Processing: Apply identical quality filtering to raw sequences before analysis with different bioinformatics pipelines [4].
- Accuracy Assessment: Compare pipeline outputs to expected compositions using sensitivity, specificity, and diversity measures [4].
Visualization of Microbiome Analysis Workflows
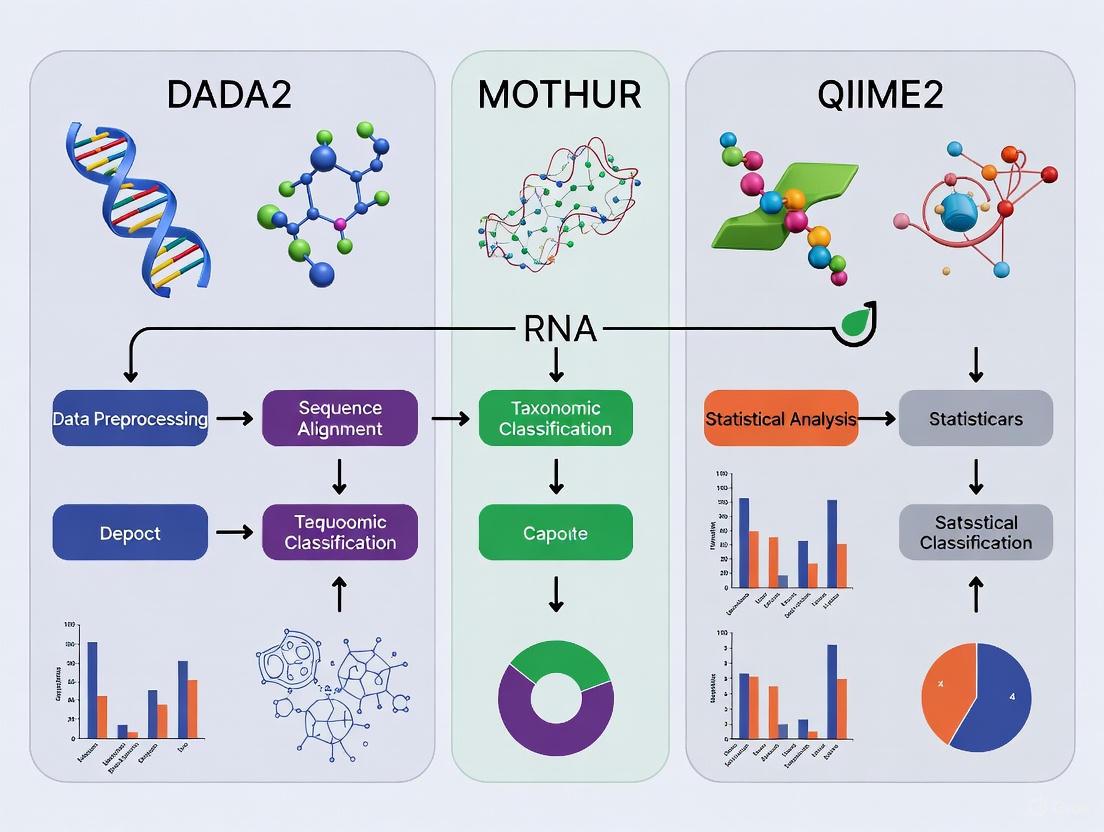
Diagram 1: Comparative workflow architectures of DADA2, QIIME 2, and MOTHUR pipelines highlight fundamental differences in sequence processing approaches, from initial quality control to final taxonomic classification.
Table 3: Key Research Reagents and Resources for Reproducible Microbiome Analysis
| Resource Category | Specific Examples | Function in Analysis | Considerations for Reproducibility |
|---|---|---|---|
| Reference Databases | SILVA, Greengenes, RefSeq | Taxonomic classification backbone | Database version control critical; prefer regularly updated databases [1] [4] |
| Mock Communities | BEI Mock Communities B & C, custom synthetic communities | Pipeline validation and benchmarking | Essential for establishing accuracy baselines [4] |
| Quality Control Tools | FastQC, MultiQC | Assess raw sequence quality | Identifies technical artifacts before analysis [6] |
| Analysis Pipelines | DADA2, QIIME 2, MOTHUR, LotuS2 | Core data processing | Version control essential; consider computational requirements [8] [4] |
| Visualization Packages | phyloseq, ggplot2, PCoA/NMDS plots | Data interpretation and exploration | Standardized visualization enables cross-study comparisons [6] |
| Workflow Management | Snakemake, Conda, Docker | Computational reproducibility | Environment encapsulation prevents dependency conflicts [9] |
Strategies for Enhancing Reproducibility
Achieving reproducible microbiome research requires both technical and methodological rigor. The following strategies emerge from recent comparative studies:
Implement Provenance Tracking: QIIME 2's integrated provenance system automatically tracks all analysis steps, creating an auditable trail from raw data to final results [5].
Standardize Experimental Protocols: As demonstrated in multi-laboratory studies, distributing identical materials and detailed protocols significantly reduces inter-laboratory variability [7].
Utilize Mock Communities: Regular validation with mock communities of known composition provides quality control and performance benchmarking [4].
Select Updated Reference Databases: Database currency significantly impacts accuracy, with SILVA and RefSeq outperforming outdated alternatives [4].
Adopt Transparent Reporting: Documenting software versions, parameters, and database references enables proper evaluation and replication [1].
Consider Hybrid Approaches: Emerging evidence suggests that metagenomic-focused tools like Kraken 2 and PathoScope may offer advantages for species-level identification in 16S data [4].
The choice of bioinformatics pipeline fundamentally shapes microbiome research outcomes and reproducibility. While DADA2, MOTHUR, and QIIME 2 can generate broadly consistent results for major biological patterns, significant differences emerge in species-level resolution, abundance estimates, and overall data structure. Evidence from standardized comparisons indicates that methodological choices, including reference database selection and computational approaches, can produce variability that impacts biological interpretation. As the field progresses, researchers must prioritize transparent reporting, standardized validation, and thoughtful pipeline selection based on specific research questions rather than convention alone. By adopting rigorous reproducibility practices and leveraging experimental data from pipeline comparisons, the microbiome research community can enhance the reliability and translational potential of their findings.
In targeted 16S rRNA gene amplicon sequencing, bioinformatic pipelines transform raw sequencing reads into meaningful biological units that represent the taxonomic composition of a sample. The field has undergone a significant methodological evolution, primarily divided into two approaches: the established Operational Taxonomic Unit (OTU) clustering method and the more recent Amplicon Sequence Variant (ASV) method. OTUs are clusters of sequencing reads grouped based on a predefined sequence similarity threshold, traditionally 97%, which approximates species-level differentiation [10] [11]. This approach intentionally blurs similar sequences into a consensus to minimize the impact of sequencing errors [10]. In contrast, the ASV approach employs denoising algorithms to identify exact biological sequences, distinguishing true variants from sequencing errors down to a single-nucleotide resolution without arbitrary clustering [10] [12] [11]. This fundamental difference in philosophy—clustering versus error-correcting—has profound implications for resolution, reproducibility, and the types of biological inferences that can be drawn from microbial community data.
Key Conceptual Differences Between OTUs and ASVs
The distinction between OTUs and ASVs is not merely technical but conceptual, influencing how microbial diversity is quantified and interpreted. The following table summarizes the core differences:
Table 1: Fundamental differences between the OTU and ASV approaches.
| Feature | OTU (Operational Taxonomic Unit) | ASV (Amplicon Sequence Variant) |
|---|---|---|
| Basic Principle | Clusters sequences based on a similarity threshold (e.g., 97%) [10] [12] | Identifies exact, error-corrected sequences; single-nucleotide resolution [12] [11] |
| Error Handling | "Averages out" errors by clustering them with true sequences [10] | Uses an error model to positively identify and remove sequencing errors [10] [12] |
| Resolution | Lower resolution; groups closely related strains and species [10] | High resolution; can distinguish between closely related strains [10] [11] |
| Reproducibility | Study-dependent; clusters can change with added data or different parameters [10] | Highly reproducible; exact sequences are stable across studies [10] [11] |
| Computational Demand | Generally less computationally intensive [11] | More computationally demanding due to denoising algorithms [11] |
| Biological Assumption | Assumes a meaningful level of diversity occurs above a fixed similarity cutoff | Assumes that true biological sequences can be discerned from noise, regardless of abundance |
Benchmarking Performance: Experimental Data from Comparative Studies
Numerous independent studies have benchmarked the performance of OTU and ASV-based pipelines using mock microbial communities (with known compositions) and large real-world datasets. The consensus indicates that ASV-based pipelines generally offer superior sensitivity and specificity, though performance varies among specific tools.
Performance on Mock Communities
A 2020 study by Prodan et al. compared six pipelines using a mock community of 20 bacterial strains, which contained 22 true sequence variants in the V4 region [13] [14]. The study's key findings on sensitivity and specificity are summarized below:
Table 2: Performance of different bioinformatic pipelines on a mock community as evaluated by Prodan et al. (2020). F-score is the harmonic mean of precision and recall.
| Pipeline | Type | Sensitivity | Specificity | Key Findings |
|---|---|---|---|---|
| DADA2 | ASV | Best | Lower than UNOISE3/Deblur | Highest sensitivity, but at the expense of specificity [13] [14] |
| USEARCH-UNOISE3 | ASV | High | Best | Best balance between resolution and specificity [13] [14] |
| Qiime2-Deblur | ASV | High | High | Strong performance, high specificity [13] [14] |
| USEARCH-UPARSE | OTU | Good | Good (but lower than ASV) | Performed well, but with lower specificity than ASV-level pipelines [13] [14] |
| MOTHUR | OTU | Good | Good (but lower than ASV) | Performed well, but with lower specificity than ASV-level pipelines [13] [14] |
| QIIME-uclust | OTU | - | - | Produced a large number of spurious OTUs; not recommended [13] [14] |
Another benchmarking study that included the LotuS2 pipeline reported that it achieved high accuracy, with 83% of reads correctly assigned at the genus level and 48% at the species level in a mock community, with the highest F-score at the ASV/OTU level compared to other pipelines [8].
Impact on Diversity Metrics and Ecological Interpretation
The choice of pipeline can significantly impact downstream ecological analysis. A 2022 study by Chiarello et al. found that the choice between DADA2 (ASV) and MOTHUR (OTU) had a stronger effect on alpha and beta diversity measures than other common methodological choices like rarefaction or OTU identity threshold (97% vs. 99%) [12] [15]. The effect was most pronounced on presence/absence indices like richness and unweighted UniFrac [12] [15]. Furthermore, different pipelines can alter the perceived relative abundance of key taxa. For instance, a comparison of four pipelines on human fecal samples found significant differences in the estimated relative abundance of major genera like Bacteroides [2] [16].
Detailed Experimental Protocols from Cited Studies
To ensure reproducibility and provide context for the performance data, here are the detailed methodologies from two key benchmarking studies.
Protocol: Prodan et al. (2020) Comparison
This study compared six pipelines using a mock community and a large human fecal dataset (N=2170) from the HELIUS study [13] [14].
- Sample Types:
- Mock Community: Genomic DNA from Microbial Mock Community B (HM-782D, BEI Resources), containing 20 bacterial strains with a known composition of 22 true sequence variants in the V4 region [13] [14].
- Human Fecal Samples: 2170 samples from the multi-ethnic HELIUS study, sequenced across 17 runs [13] [14].
- Wet-Lab Protocol:
- Bioinformatic Pipelines & Key Parameters:
- OTU-based: QIIME-uclust (v1.9.1), MOTHUR (v1.39.5), USEARCH-UPARSE (v10.0.240). Clustering was performed at 97% identity.
- ASV-based: DADA2 (v1.7.0), Qiime2-Deblur (v2017.6.0), USEARCH-UNOISE3 (v10.0.240).
- Read Processing: For pipelines other than DADA2 and MOTHUR, merged reads were processed with USEARCH using specific parameters: maxdiffs=30 in the merging step and max expected errors (maxee)=1 for quality filtering to maximize read retention and error correction [13] [14].
Protocol: Chiarello et al. (2022) Comparison
This study focused on the comparative effect of pipeline choice versus other common methodological decisions in environmental and host-associated samples [12] [15].
- Sample Types:
- Wet-Lab Protocol:
- Bioinformatic Pipelines & Key Parameters:
- OTU-based: MOTHUR (v1.8.0) following the MiSeq SOP. Sequences were aligned to the SILVA v138 database, and chimeras were removed with VSEARCH. OTUs were generated at 97% and 99% identity thresholds [12] [15].
- ASV-based: DADA2 (R package, v1.16) with standard denoising parameters [12] [15].
- Downstream Analysis: The community tables were used to compare the effects of pipeline choice, rarefaction level, and OTU threshold on alpha and beta diversity metrics [12] [15].
Logical Workflow of OTU vs. ASV Pipelines
The following diagram illustrates the core logical differences in how OTU-based and ASV-based pipelines process raw sequencing reads to arrive at their final output.
For researchers aiming to conduct similar comparative analyses or standardize their microbiome workflow, the following tools and databases are essential.
Table 3: Essential reagents, software, and databases for microbiome bioinformatics.
| Item Name | Type | Function / Application | Example Source / Version |
|---|---|---|---|
| Mock Microbial Community | Standard | Validates pipeline accuracy and sensitivity using a sample of known composition. | BEI Resources, HM-782D [13] [14] |
| Silva SSU rRNA Database | Reference Database | Provides a curated taxonomy and alignment reference for 16S rRNA gene sequences. | SILVA 132/138 [2] [12] [16] |
| DADA2 | R Package / ASV Pipeline | Infers amplicon sequence variants (ASVs) from Illumina amplicon data via a parametric error model and denoising. | R package, v1.7.0+ [13] [12] [14] |
| QIIME 2 (with Deblur) | Framework / ASV Pipeline | An open-source, scalable microbiome analysis platform with Deblur for ASV inference via error profile-based subtraction. | Qiime2 v2017.6.0+ [13] [14] |
| USEARCH (UNOISE3/UPARSE) | Software Suite | A versatile tool suite offering both ASV (UNOISE3) and OTU (UPARSE) clustering algorithms. | USEARCH v10.0.240+ [13] [14] |
| MOTHUR | Software Suite / OTU Pipeline | A comprehensive, single-purpose software for the OTU-based analysis of 16S rRNA sequence data. | MOTHUR v1.39.5+ [13] [12] [14] |
| LotuS2 | Software Pipeline | A lightweight, user-friendly pipeline offering multiple clustering algorithms (DADA2, UNOISE3, VSEARCH) and high speed [8]. | LotuS2 [8] |
The collective evidence from rigorous benchmarking studies indicates a paradigm shift in microbiome bioinformatics from OTU-based clustering toward ASV-based denoising. ASV methods (DADA2, QIIME2-Deblur, UNOISE3) provide superior resolution, higher reproducibility across studies, and more effective correction of sequencing errors [10] [13] [11]. While OTU-based pipelines like MOTHUR and UPARSE remain valid and can perform well, particularly in well-characterized environments like the human gut, they generally exhibit lower specificity and are more susceptible to reference database biases [10] [13].
The choice of the specific ASV pipeline, however, involves trade-offs. DADA2 often demonstrates the highest sensitivity for detecting true variants, sometimes at the cost of specificity, while UNOISE3 frequently strikes the best balance between resolution and specificity [13] [14]. For research questions requiring the detection of fine-scale ecological patterns or precise tracking of strains across studies, ASVs are the unequivocal choice. The field's movement towards ASVs, supported by robust experimental data, underscores the importance of higher accuracy and cross-study comparability in advancing microbiome science.
The Impact of Analytical Variability on Biological Interpretation and Clinical Translation
Microbiome research has become a cornerstone of basic and translational science, with significant potential for informing clinical practice [1]. However, the translational path from microbial insights to clinical applications remains challenging, constrained by methodological and analytical limitations [17]. A critical source of this constraint is analytical variability—the variation introduced by different bioinformatic processing methods, which can significantly impact biological interpretation and hinder clinical translation. This guide provides an objective comparison of three widely used bioinformatics pipelines—DADA2, MOTHUR, and QIIME2—focusing on their performance in reproducing microbial community analyses, a fundamental prerequisite for reliable biological interpretation and downstream clinical application.
Performance Comparison of Major Bioinformatics Pipelines
Comparative studies reveal that while different bioinformatics pipelines can generate broadly consistent results, significant differences in performance metrics exist that can influence biological interpretation.
Table 1: Comparative Performance of Bioinformatics Pipelines across Study Types
| Pipeline | Primary Output | Sensitivity & Specificity Balance | Reproducibility of Microbial Patterns | Key Findings from Comparative Studies |
|---|---|---|---|---|
| DADA2 | Amplicon Sequence Variants (ASVs) | High sensitivity, but may have lower specificity compared to UNOISE3 [14]. | Reproducible results for H. pylori status, diversity, and relative abundance [1]. | Resolves sequences to single-nucleotide differences; provides the finest resolution [2]. |
| MOTHUR | Operational Taxonomic Units (OTUs) | Good performance, though may show lower specificity compared to ASV-level pipelines [14]. | Reproducible outcomes in microbial composition across independent research groups [1]. | Uses a clustering-based approach (typically 97% identity); a well-established, standardized tool [2]. |
| QIIME2 | ASVs (via plugins like DADA2, Deblur) or OTUs | Varies with plugin. Overall, generates comparable results to other robust pipelines [1]. | Consistent identification of inoculum-dependent changes in plant phenotype and microbiome [7]. | A modular, extensible framework that supports multiple modern denoising algorithms [2]. |
Table 2: Impact of Pipeline Choice on Downstream Analytical Results
| Analysis Type | Impact of Pipeline Variability | Supporting Evidence |
|---|---|---|
| Taxonomic Assignment | Relative abundance estimates for phyla and genera can differ significantly (p < 0.05) even when taxa identities are consistent [2]. | A study on human stool samples found significant differences in abundant genera like Bacteroides across pipelines [2]. |
| Alpha-Diversity | Inflated or altered diversity measures can occur with some pipelines, potentially masking or exaggerating biological effects [14]. | QIIME-uclust (an older pipeline) was noted to produce inflated alpha-diversity and should be avoided [14]. |
| Community Structure | Core biological findings (e.g., disease-associated shifts) are generally reproducible across robust pipelines, enabling reliable high-level interpretation [1]. | Five independent research groups using different protocols reproducibly identified H. pylori-driven microbial changes in gastric cancer [1]. |
Experimental Protocols for Pipeline Comparison
To ensure rigorous and reproducible comparisons, studies must employ standardized experimental designs and protocols. The following methodologies are derived from published comparative analyses.
Sample Collection and DNA Sequencing
- Sample Types: Studies utilize both mock communities (artificial mixtures of known microbial strains) and real biological samples (e.g., human stool, gastric biopsies, plant rhizospheres) [14] [1] [7]. Mock communities provide a ground truth for evaluating sensitivity and specificity, while real samples assess performance under realistic conditions.
- Laboratory Protocols: For human gut microbiome studies, DNA is typically extracted from stool samples (e.g., 150-200 mg) using kits with bead-beating mechanical disruption. The 16S rRNA gene (e.g., V3-V4 or V4 hypervariable regions) is amplified with primers containing Illumina adapter sequences. Libraries are then normalized, pooled, and sequenced on Illumina platforms (e.g., MiSeq) [2] [14].
- Multi-Laboratory Design: To assess reproducibility, a ring trial design can be implemented where multiple laboratories receive identical materials (e.g., synthetic communities, seeds, EcoFAB devices) and follow a centralized, detailed protocol for DNA extraction, library preparation, and sequencing [7].
Bioinformatic Processing and Analysis
- Pipeline Execution: The same dataset of raw sequencing files (FASTQ) is processed independently through each pipeline (DADA2, MOTHUR, QIIME2) using default or author-recommended parameters [14].
- Data Output Alignment: To enable direct comparison, the filtered sequences from each pipeline are typically aligned against a common taxonomic reference database, such as SILVA or Greengenes [1] [2].
- Comparative Metrics: The following outcomes are systematically compared across pipelines:
- Sensitivity and Specificity: The number of expected species/strains correctly identified versus spurious taxa introduced, as measured using mock community data [14].
- Taxonomic Composition: Relative abundances of major phyla and genera in biological samples [2].
- Alpha and Beta Diversity: Metrics of within-sample and between-sample diversity [14].
- Reproducibility of Key Findings: Consistency in identifying primary biological drivers (e.g., the effect of a pathogen like H. pylori) [1].
Visualizing the Comparative Analysis Workflow
The following diagram illustrates the standardized workflow for a rigorous pipeline comparison study.
The Scientist's Toolkit: Essential Research Reagents and Materials
Table 3: Key Reagents and Materials for Reproducible Microbiome Research
| Item | Function in Research | Example Use-Case |
|---|---|---|
| Synthetic Microbial Communities (SynComs) | Defined mixtures of known bacterial strains that serve as a controlled ground truth for validating bioinformatic pipelines and laboratory protocols [7]. | A 17-member SynCom from a grass rhizosphere was used to test the reproducible assembly of microbiomes across five laboratories [7]. |
| Fabricated Ecosystem (EcoFAB) Devices | Standardized, sterile laboratory habitats that minimize environmental variability, enabling highly reproducible studies of plant-microbe interactions [7]. | EcoFAB 2.0 devices were used in a ring trial to ensure consistent plant growth and microbiome assembly across different research sites [7]. |
| Mock Community Standards | Commercially available genomic DNA from a defined set of microorganisms, used to verify sequencing accuracy and bioinformatic classification [18]. | The ZymoBIOMICS Microbial Community Standard is used to confirm technical reproducibility in sequencing runs [18]. |
| Reference Databases (SILVA, Greengenes) | Curated collections of rRNA sequences that are essential for the taxonomic assignment of sequences processed by any pipeline [1]. | Alignment of sequences to different databases (SILVA vs. Greengenes) had only a limited impact on taxonomic assignments in a gastric microbiome study [1]. |
| Negative Controls | Sample-free controls (e.g., extraction blanks, no-template PCR controls) that are crucial for identifying and removing contaminating DNA sequences, especially in low-biomass studies [18]. | Used with the 'decontam' R package to identify and filter out reagent-derived contaminants in human milk microbiome data [18]. |
The evidence demonstrates that robust bioinformatics pipelines like DADA2, MOTHUR, and QIIME2 can generate reproducible and comparable results for core biological questions when applied to the same dataset [1]. This consistency is crucial for interpreting studies and underscores the broader applicability of microbiome analysis in clinical research. However, analytical variability in relative abundance estimates persists and is sufficient to prevent direct quantitative comparisons between studies that used different processing workflows [2].
To overcome this barrier and enhance clinical translation, the field is moving toward greater standardization and the adoption of artificial intelligence (AI) tools [17]. The future of credible clinical inferences in microbiome research depends on rigorous, reproducible methodologies that integrate multi-omics approaches and iterative experiments across diverse model systems [19] [17]. By adhering to standardized protocols, using common reagents and controls, and transparently reporting bioinformatic workflows, researchers can break the reproducibility barrier and accelerate the translation of microbiome insights into clinical diagnostics and therapies.
The analysis of microbial communities through 16S rRNA gene sequencing has become a fundamental tool in microbial ecology, human health research, and therapeutic development. A bioinformatic pipeline transforms raw sequencing data into meaningful ecological metrics through a structured sequence of computational processes. The reproducibility and accuracy of these pipelines are paramount for generating reliable, comparable results across studies. This guide provides an objective comparison of three widely used bioinformatics platforms—DADA2, MOTHUR, and QIIME2—focusing on their performance in processing raw sequences to generate ecological metrics, with supporting experimental data from comparative studies.
The ongoing debate regarding pipeline selection often centers on their methodological approaches: DADA2 and QIIME2 (which incorporates DADA2) typically infer amplicon sequence variants (ASVs), while MOTHUR traditionally clusters sequences into operational taxonomic units (OTUs). ASVs are resolved to single-nucleotide differences, offering higher resolution, whereas OTUs bin sequences with typically less than 3% variance [2]. Understanding the components and performance of these tools is crucial for researchers making informed decisions that affect downstream biological interpretations.
Pipeline Architecture and Key Components
A standardized bioinformatic pipeline for 16S rRNA amplicon analysis consists of several sequential stages, each with distinct computational goals. The architecture is largely consistent across platforms, though implementation details and algorithmic approaches vary significantly.
Diagram 1: Bioinformatic Pipeline Workflow. The generalized workflow for 16S rRNA amplicon analysis shows the key stages from raw data to ecological metrics, with platform-specific implementations for the denoising/clustering step.
The key components of a robust bioinformatic pipeline include [20]:
Data Collection and Preprocessing: Gathering raw sequencing data (FASTQ files) and associated metadata. Preprocessing involves quality checks, primer removal, and filtering to ensure data accuracy. Tools like FastQC and BBduk.sh are often employed [21].
Sequence Processing and Denoising/Clustering: This core step reduces sequencing errors and groups sequences into biological units. DADA2 uses a parametric error model to infer exact amplicon sequence variants (ASVs), while MOTHUR typically clusters sequences into OTUs based on a 97% similarity threshold [2] [22]. QIIME2 offers multiple denoising options, including DADA2 and Deblur [23].
Taxonomic Assignment: Filtered sequences are aligned against reference databases (e.g., SILVA, Greengenes, RDP) to classify organisms taxonomically [1] [21]. The choice of database can influence results, though studies show this impact may be limited compared to pipeline choice [1].
Diversity Analysis and Ecological Metrics: This includes calculating alpha-diversity (within-sample diversity) and beta-diversity (between-sample diversity) metrics, producing the final ecological interpretations [24] [21].
Visualization and Reporting: Generating figures, tables, and interactive visualizations to communicate results effectively. Platforms differ in their visualization capabilities, with some offering integrated solutions like iMAP's web-based reports [21].
Comparative Performance Analysis
Experimental Data on Pipeline Reproducibility
A 2025 comparative study investigated the reproducibility of gastric mucosal microbiome composition across three bioinformatics packages (DADA2, MOTHUR, and QIIME2) applied by five independent research groups to the same dataset [1]. The dataset included 16S rRNA gene raw sequencing data from gastric biopsy samples of gastric cancer patients (n=40) and controls (n=39), with and without Helicobacter pylori infection.
Table 1: Reproducibility of Key Microbial Metrics Across Pipelines (2025 Study)
| Metric | DADA2 | MOTHUR | QIIME2 | Concordance |
|---|---|---|---|---|
| H. pylori Status Detection | Reproducible | Reproducible | Reproducible | High across all platforms |
| Microbial Diversity Patterns | Consistent | Consistent | Consistent | Comparable results |
| Relative Bacterial Abundance | Reproducible | Reproducible | Reproducible | Minor quantitative differences |
| Impact of Taxonomic Database (SILVA vs. Greengenes) | Limited | Limited | Limited | Minimal effect on outcomes |
The study concluded that independent of the applied protocol, H. pylori status, microbial diversity and relative bacterial abundance were reproducible across all platforms, although differences in performance were detected [1]. This demonstrates that robust pipelines can generate comparable results, crucial for interpreting studies and underscoring the broader applicability of microbiome analysis in clinical research.
Quantitative Output Comparisons
A 2020 study provided a direct quantitative comparison of four pipelines (QIIME2, Bioconductor, UPARSE, and MOTHUR) run on two operating systems, analyzing 40 human stool samples [2]. The research revealed important differences in output characteristics.
Table 2: Quantitative Output Comparison Across Pipelines (2020 Study)
| Pipeline | Analysis Type | Feature Units | Relative Abundance of Bacteroides* | OS Dependency |
|---|---|---|---|---|
| QIIME2 | ASV-based | Single-nucleotide resolution | 24.5% | None (identical Linux vs. Mac) |
| Bioconductor | ASV-based | Single-nucleotide resolution | 24.6% | None (identical Linux vs. Mac) |
| UPARSE (Linux) | OTU-based | 97% similarity clusters | 23.6% | Minimal differences |
| UPARSE (Mac) | OTU-based | 97% similarity clusters | 20.6% | Minimal differences |
| MOTHUR (Linux) | OTU-based | 97% similarity clusters | 22.2% | Minimal differences |
| MOTHUR (Mac) | OTU-based | 97% similarity clusters | 21.6% | Minimal differences |
*The difference in relative abundance was statistically significant (p < 0.001), demonstrating that pipeline choice affects quantitative estimates [2].
The study found that while taxa assignments were consistent at both phylum and genus level across all pipelines, statistically significant differences emerged in relative abundance estimates for all phyla (p < 0.013) and most abundant genera (p < 0.028) [2]. This indicates that studies using different pipelines cannot be directly compared without appropriate normalization procedures.
Computational Efficiency and Practical Implementation
Regarding computational performance, cloud-based implementations demonstrate significant efficiency gains. One study developed a microbiome analysis pipeline using Amazon Web Services (AWS) that successfully processed 50 gut microbiome samples within 4 hours at a cost of approximately $0.80 per hour for a c4.4xlarge EC2 instance [24]. This highlights how cloud computing can provide accessible, scalable resources for pipeline implementation.
The integration of pipelines like iMAP (Integrated Microbiome Analysis Pipeline) demonstrates efforts to create more user-friendly solutions that wrap functionalities for metadata profiling, quality control, sequence processing, classification, and diversity analysis while generating web-based progress reports [21]. Such integrated approaches enhance reproducibility and accessibility for researchers with varying computational expertise.
Experimental Protocols and Methodologies
Standardized Testing Protocols
To ensure fair comparisons between pipelines, researchers have developed standardized testing methodologies. The 2025 reproducibility study employed this protocol [1]:
- Sample Selection: 79 gastric biopsy samples (40 GC patients, 39 controls) with varying H. pylori status
- Sequencing Parameters: 16S rRNA gene (V1-V2 regions) raw sequencing data
- Analysis Groups: Five independent research groups applying their preferred protocols
- Comparison Metrics: H. pylori detection, alpha/beta diversity measures, taxonomic composition
- Database Alignment Testing: Filtered sequences aligned to RDP, Greengenes, and SILVA databases
Another comparative analysis between QIIME2 and DADA2 implemented this reproducible workflow [25]:
Research Questions:
- How do ASV tables from QIIME2 (via q2-dada2) and standalone DADA2 differ in feature count and read depth?
- What are the computational time and resource usage differences?
- How does tool choice influence downstream ecological conclusions?
Evaluation Metrics:
- Feature count and read depth comparisons
- Computational efficiency and resource usage
- Alpha and beta diversity outcomes
- Taxonomic assignment consistency
Denoising Method Comparison Protocol
A detailed comparison between DADA2 and Deblur (another denoising algorithm available in QIIME2) highlights the importance of parameter optimization [23]:
- Dataset: Large avian cloacal swab 16S dataset (initial 30,761,377 sequences)
- Preprocessing: Primer removal with cutadapt within QIIME2
- DADA2 Parameters: Applied directly on unmerged paired-end sequences
- Deblur Parameters: Sequences merged using vsearch, quality filtered, then denoised
- Results: DADA2 yielded 21,637,825 sequences (15,042 features) vs. Deblur's 7,749,895 sequences (9,373 features)
- Key Finding: Despite different absolute numbers, downstream biological interpretations (beta diversity, taxonomic composition) were remarkably similar
Table 3: Essential Research Reagents and Computational Tools for Pipeline Implementation
| Category | Item | Function/Purpose | Examples/Options |
|---|---|---|---|
| Wet Lab Reagents | DNA Extraction Kit | Isolates microbial DNA from samples | QIAamp DNA Stool Mini Kit [2] |
| PCR Amplification Reagents | Amplifies target 16S rRNA regions | Illumina 16S Metagenomic Sequencing Library Preparation protocol [2] | |
| Sequencing Chemicals | Generates raw sequence data | MiSeq v3 cartridge (Illumina) [2] | |
| Bioinformatic Tools | Quality Control Tools | Assesses read quality and filters artifacts | FastQC, BBduk.sh, Seqkit [21] |
| Denoising/Clustering Algorithms | Groups sequences into biological units | DADA2 (ASVs), MOTHUR (OTUs), Deblur [1] [23] | |
| Taxonomic Databases | Reference for classifying sequences | SILVA, Greengenes, RDP, EzBioCloud [1] [21] | |
| Statistical Analysis Platforms | Computes diversity metrics and statistics | R, Python, QIIME2, Bioconductor [2] [20] | |
| Computational Infrastructure | Cloud Computing Services | Provides scalable computational resources | Amazon Web Services (AWS) EC2 instances [24] |
| Workflow Management Systems | Ensures reproducibility and portability | Nextflow, Snakemake, Docker containers [21] | |
| Visualization Tools | Creates interpretable data representations | iTOL, RStudio, Tableau, Matplotlib [20] [21] |
The comparative analysis of DADA2, MOTHUR, and QIIME2 reveals a complex landscape where each platform offers distinct advantages. The 2025 reproducibility study demonstrates that robust pipelines generate broadly comparable biological conclusions when applied to the same dataset, particularly for major factors like H. pylori status and overall diversity patterns [1]. However, significant differences in relative abundance estimates highlight that quantitative comparisons across studies using different pipelines require caution [2].
For researchers selecting pipelines, consider these evidence-based recommendations:
- For highest resolution: DADA2 or QIIME2 with DADA2 plugin offer single-nucleotide resolution through ASVs [25] [26]
- For established methodologies: MOTHUR provides well-validated OTU-based approaches with extensive documentation [22]
- For modularity and integration: QIIME2 offers a comprehensive, plugin-based ecosystem with standardized outputs [1] [21]
- For clinical applications: Emerging tools like MetaScope show promise for enhanced species-level classification beyond traditional pipelines [26]
The reproducibility crisis in microbiome research can be mitigated by thorough documentation of pipeline parameters, use of standardized protocols when possible, and transparency about computational methods. Future developments in pipeline harmonization and validation against mock communities will further enhance the reliability and comparability of microbiome studies across the research community.
From Theory to Practice: Implementing DADA2, QIIME2, and MOTHUR Pipelines
A Step-by-Step Guide to the DADA2 Workflow for Error-Corrected ASVs
In the field of microbiome research, the analysis of 16S rRNA gene amplicon sequencing data has been revolutionized by high-resolution techniques that infer amplicon sequence variants (ASVs). DADA2 stands as a prominent algorithm within this category, offering a denoising-based approach that provides a higher-resolution alternative to traditional operational taxonomic unit (OTU) methods [27]. This guide details the DADA2 workflow, frames it within the critical context of pipeline reproducibility, and objectively compares its performance against other widely used bioinformatics platforms like QIIME2 and mothur, providing researchers with the data needed to select the most appropriate tool for their microbiome studies.
Section 1: The DADA2 Workflow - A Step-by-Step Protocol
The DADA2 pipeline transforms raw, demultiplexed FASTQ files into a refined ASV table, which records the number of times each exact amplicon sequence variant was observed in each sample [3]. The following diagram outlines the core steps of this workflow.
- Step 1: Inspect Read Quality Profiles. The workflow begins by visualizing the quality profiles of the forward and reverse reads using the
plotQualityProfilefunction. This critical step determines the trimming parameters by identifying positions where read quality significantly deteriorates. For example, in a common 2x250 MiSeq protocol, forward reads might be truncated at position 240 and reverse reads at position 160 [3]. - Step 2: Filter and Trim Reads. The
filterAndTrimfunction applies the parameters determined in Step 1. Standard filtering parameters includemaxN=0(DADA2 requires no Ns),truncQ=2,rm.phix=TRUEto remove PhiX spike-in reads, andmaxEE=2, which sets the maximum number of "expected errors" allowed in a read, providing a superior filtering approach than averaging quality scores [3]. - Step 3: Learn Error Rates. DADA2 uses a novel algorithm to model the errors introduced during amplicon sequencing. The
learnErrorsfunction learns this error model from the data itself, which is subsequently used to infer the true biological sequences in the sample with high accuracy [27] [3]. - Step 4: Dereplicate Sequences. The
derepFastqfunction condenses the data by combining identical sequences, reducing computation time for the core sample inference algorithm [3]. - Step 5: Infer Sample Composition. The core
dadafunction applies the error model to the dereplicated data. It differentiates true biological sequence variants from spurious ones caused by sequencing errors, thereby inferring the exact amplicon sequence variants (ASVs) present in each sample [27]. - Step 6: Merge Paired Reads. For paired-end data, the
mergePairsfunction combines the forward and reverse reads after they have been denoised, creating fully overlapping, contiged sequences. A minimum overlap of 20 nucleotides is typical, and the function can also screen for spurious merges [3]. - Step 7: Construct ASV Table. The
makeSequenceTablefunction creates the final ASV table—a matrix with samples as columns and the inferred ASVs as rows, where each entry is the number of times that ASV was observed in that sample. This table is a higher-resolution analogue of the traditional OTU table [3]. - Step 8: Remove Chimeras. The final step involves identifying and removing chimeric sequences using
removeBimeraDenovo. Chimeras are artificial sequences formed from two or more biological sequences during PCR and are crucial to remove for obtaining reliable ASV data [27].
Section 2: Experimental Protocols for Pipeline Comparison
To objectively benchmark DADA2 against other pipelines, researchers often employ mock microbial communities, where the true composition is known. The protocol below, derived from a 2025 benchmarking study, illustrates a standardized methodology [28].
Mock Community Experiment Protocol:
- Sample Source: Utilize a complex mock community, such as the HC227 community comprising genomic DNA from 227 bacterial strains across 197 species [28].
- Sequencing: Amplify the V3-V4 or V4 region of the 16S rRNA gene and sequence on an Illumina MiSeq platform in a 2x300 bp paired-end run [28].
- Data Preprocessing:
- Quality Check: Use FastQC for initial sequence quality assessment.
- Primer Stripping: Remove primer sequences using tools like
cutPrimers. - Read Merging & Trimming: Merge paired-end reads and perform length trimming.
- Quality Filtering: Discard reads with ambiguous characters and apply a stringent maximum expected error threshold [28].
- Pipeline Analysis: Process the unified, preprocessed data through multiple bioinformatics pipelines, including DADA2, UPARSE, and mothur, using their standard parameters [28].
- Output Comparison: Compare the pipelines' outputs (ASVs or OTUs) against the known reference sequences of the mock community. Key metrics include error rate, over-splitting (generating multiple variants for one strain) vs. over-merging (grouping distinct strains into one unit), and the accuracy of the inferred microbial composition and diversity [28].
Section 3: Performance Comparison of Microbiome Pipelines
The following tables summarize key quantitative findings from independent comparative studies, evaluating DADA2, QIIME2 (which can use DADA2 as a plugin), UPARSE, and mothur.
Table 1: Algorithmic Comparison of Major 16S rRNA Analysis Pipelines
| Pipeline | Core Method | Primary Output | Key Strengths | Key Limitations |
|---|---|---|---|---|
| DADA2 | Denoising; models sequencing errors to infer biological sequences [27]. | ASVs (Exact Sequence Variants) [27]. | Single-nucleotide resolution; high sensitivity; produces consistent, reproducible ASVs across studies [28]. | Can suffer from over-splitting of non-identical 16S rRNA gene copies within a single strain [28]. |
| QIIME2 | Modular platform; can utilize DADA2, Deblur, or other plugins [29]. | ASVs (when using DADA2/Deblur). | Comprehensive, user-friendly platform; tracks full data provenance; extensive plugin ecosystem [29]. | Performance depends on the chosen denoising/clustering plugin. |
| UPARSE | Greedy clustering of sequences based on identity [28]. | OTUs (97% identity). | Lower error rates in clusters; less over-splitting; efficient performance [28]. | Uses fixed similarity cutoff, which may obscure real biological variation; prone to over-merging distinct taxa [28]. |
| mothur | Distance-based clustering (e.g., average neighbor, Opticlust) [28]. | OTUs (97% identity). | Well-established, extensive SOPs; intensive quality filtering [21]. | Similar to UPARSE, relies on fixed clustering thresholds [28]. |
Table 2: Experimental Performance Metrics from Mock Community Studies
| Performance Metric | DADA2 | UPARSE | mothur | Experimental Context |
|---|---|---|---|---|
| Resemblance to Intended Community | High (One of the closest) | High (One of the closest) | Moderate | Analysis of the HC227 mock community (227 strains) using PE reads [28]. |
| Error Tendency | Over-splitting [28] | Over-merging [28] | Over-merging [28] | Evaluation of splitting/merging behavior against known reference sequences [28]. |
| Relative Abundance Accuracy (Bacteroides) | 24.5% [2] | 20.6% - 23.6% [2] | 21.6% - 22.2% [2] | Comparison on human stool samples; all pipelines showed statistically significant differences in abundance estimates [2]. |
| Output Consistency Across OS | N/A | Minimal differences [2] | Minimal differences [2] | QIIME2 and Bioconductor (which runs DADA2) provided identical outputs on Linux and Mac OS [2]. |
Table 3: Key Resources for Implementing the DADA2 Workflow
| Resource Name | Type | Function in the Workflow |
|---|---|---|
| R / RStudio | Software Environment | The primary environment for installing and running the DADA2 R package and associated analysis scripts [3]. |
| dada2 R Package | R Library | Implements the core denoising, merging, and chimera removal functions of the workflow [3]. |
| SILVA / Greengenes | Reference Database | Curated databases of 16S rRNA sequences used for assigning taxonomy to the inferred ASVs [21]. |
| Mock Community | Control Reagent | A sample composed of known microbial strains, essential for validating and benchmarking the performance of the bioinformatics pipeline [28]. |
| Amazon EC2 (c4.4xlarge) | Computational Resource | A cloud-based virtual server instance suitable for high-performance computation, capable of processing 50 gut microbiome samples in ~4 hours [24]. |
| FastQC | Bioinformatics Tool | Provides initial quality control reports for raw FASTQ files, informing trimming and filtering parameters [28]. |
Section 5: Discussion: Reproducibility in Microbiome Bioinformatics
The choice of bioinformatics pipeline significantly impacts research outcomes, as different tools can yield variations in taxonomic assignment and relative abundance estimates [2]. This underscores a central challenge in microbiome research: ensuring reproducibility and cross-study comparability.
DADA2 contributes to reproducibility by generating exact ASVs that can be directly compared across studies without re-clustering, unlike traditional OTUs [27]. Furthermore, when used within integrated platforms like QIIME2, which automatically tracks all parameters and steps (provenance), the entire analytical process becomes more transparent and repeatable [29]. For the highest level of reproducibility, researchers are increasingly adopting containerized technologies like Docker, which package the entire analysis environment (software, dependencies, and code), and leveraging cloud computing platforms like Amazon Web Services (AWS), which provide standardized, powerful computational resources [24] [21].
DADA2 provides a powerful, denoising-based workflow for achieving high-resolution insights into microbial communities via ASVs. While it excels in sensitivity and resolution, benchmarking shows it has a characteristic tendency towards over-splitting compared to the over-merging of OTU-based methods like UPARSE. The selection of an analytical pipeline should therefore be a deliberate decision, informed by the specific research question and the documented performance characteristics of each tool. To ensure robust and reproducible science, researchers should validate their chosen pipeline with mock communities, thoroughly document all parameters, and leverage modern computational solutions that enhance consistency and transparency in microbiome data analysis.
In the pursuit of reproducible microbiome bioinformatics, the choice of processing tools within a pipeline is paramount. For 16S rRNA marker gene data, two critical and divergent steps are the bioinformatic correction of sequencing errors (denoising) to define biological sequences and the subsequent taxonomic classification of those sequences. Within the widely adopted QIIME 2 ecosystem, DADA2 and Deblur represent the primary approaches for denoising, transforming raw sequencing reads into amplicon sequence variants (ASVs). Following this, the q2-feature-classifier plugin, often used with pre-trained classifiers, assigns taxonomy to these ASVs. This guide provides an objective, data-driven comparison of these core QIIME 2 plugins, framing their performance within a broader thesis on the reproducibility of microbiome bioinformatics pipelines. Understanding the operational differences, outputs, and optimal use cases for DADA2 and Deblur, as well as the resources available for taxonomic assignment, empowers researchers to make informed decisions that enhance the reliability and interpretability of their data.
DADA2 vs. Deblur: A Conceptual and Methodological Comparison
DADA2 and Deblur achieve the same core goal—denoising marker gene sequences to resolve fine-scale variation—but through fundamentally different algorithms and workflows.
Core Algorithmic Differences
- DADA2: Employs a parametric error model that learns specific error rates from the dataset itself. It models substitutions as a function of the transition/transversion rate and the sequence quality scores, treating the denoising problem as a statistical inference task to distinguish true biological sequences from erroneous ones [30].
- Deblur: Uses a positive, non-parametric filtering approach based on read abundance profiles. It operates under the principle that true sequences will be observed multiple times, while error-containing reads will be rare variants of more abundant sequences. Deblur aggressively removes these low-frequency variants to arrive at the true biological sequences [31].
Workflow and Input Requirements
A key practical difference lies in their handling of sequence length and read merging.
DADA2 internally manages read merging, while Deblur requires pre-joined sequences [31] [23].
- DADA2: For paired-end reads, the
denoise-pairedaction processes forward and reverse reads separately before merging them post-denoising. It does not require all output sequences to be the same length, accepting a range of sequence lengths in its output [31]. - Deblur: The
denoise-16Saction requires all input sequences to be of a uniform length, specified by the--p-trim-lengthparameter. For paired-end data, this necessitates an upstream read-joining step (e.g., usingq2-vsearch) and often an additional quality-filtering step before denoising can begin [31] [23].
Experimental Performance and Data Output Comparison
A direct application of both denoisers to the same dataset reveals significant differences in output, which can impact downstream biological interpretation.
Empirical Case Study: Avian Cloacal Swab Dataset
In a comparative analysis, both DADA2 and Deblur were run on a large 16S dataset from avian cloacal swabs containing an initial 30,761,377 sequences [23]. The table below summarizes the key quantitative outcomes from this experiment.
Table 1: Denoising Output Comparison on a 16S Avian Cloacal Swab Dataset [23]
| Metric | DADA2 | Deblur |
|---|---|---|
| Initial Sequences | 30,761,377 | 30,761,377 |
| Final Non-Chimeric Sequences | 21,637,825 | 7,749,895 |
| Final Features (ASVs) | 15,042 | 9,373 |
| Sequence Retention Rate | ~70.3% | ~25.2% |
| Feature Characteristics | Varying lengths (85.6% at 253bp) | All sequences 253bp |
Interpretation of Discrepancies and Downstream Consistency
- Sequence Retention: DADA2 retained nearly three times as many sequences as Deblur. This dramatic difference is attributed to Deblur's more aggressive filtering, which may discard more sequences, including potentially real low-abundance biological variants [23].
- Feature Resolution: DADA2 recovered substantially more ASVs (~15k vs. ~9k), suggesting a higher resolution of sequence variants. The length distribution of DADA2 features showed that while most (85.6%) were the expected 253bp, a significant minority were shorter or longer, which Deblur's uniform length requirement would automatically exclude [23].
- Biological Concordance: Despite the large discrepancies in absolute numbers, the study noted that downstream beta-diversity (UniFrac PCoA) and phylum-level composition results were highly similar between the two methods. This indicates that while the fine-scale ASV lists differ, the broader ecological conclusions can be robust across denoising choices [23].
Taxonomic Classification within QIIME 2
After generating ASVs, the next critical step is assigning taxonomy using the q2-feature-classifier plugin. This typically involves aligning sequences against a curated reference database.
The Taxonomic Classification Workflow
The process generally involves a pre-trained classifier that matches your sequences to a reference database. QIIME 2 provides several such classifiers, tailored to different genes and regions [32].
The standard taxonomic classification workflow in QIIME2 uses a pre-trained Naive Bayes classifier [32].
Available Pre-trained Classifiers
The choice of reference database is critical. Researchers must select a classifier compatible with their QIIME 2 version and trained on the appropriate gene region.
Table 2: Selected Pre-trained Naive Bayes Classifiers for QIIME 2 (2024.5 - Present) [32]
| Reference Database | Target Gene Region | UUID (for download) | Key Notes |
|---|---|---|---|
| Silva 138 99% OTUs | Full-length / 515F/806R | 70b4b5f4-8fce-40bd-b508-afacbc12a5ed |
Species-level taxonomy may be unreliable |
| Greengenes2 2024.09 | Full-length / 515F/806R | 49ccfb0a-155d-404b-80b4-818d2aeb53b2 |
Successor to Greengenes 13_8 |
| GTDB r220 | Full-length | 5d5461cc-6a51-434b-90ab-040f388e4221 |
Based on Genome Taxonomy Database |
Experimental Protocols for Reproducible Analysis
To ensure reproducibility, detailed methodologies for key steps are essential.
Protocol A: Denoising Paired-End Reads with DADA2
This protocol is adapted from the "Moving Pictures" tutorial and community best practices [30] [31] [23].
- Import Data: Import demultiplexed paired-end FASTQs using a manifest file and
qiime tools importwith typeSampleData[PairedEndSequencesWithQuality]. - Primer Removal: Trim sequencing adapters and primers using
qiime cutadapt trim-paired. - Denoise: Run
qiime dada2 denoise-paired. Critical parameters include:--i-demultiplexed-seqs: Input trimmed sequences.--p-trunc-len-fand--p-trunc-len-r: Positions to truncate forward and reverse reads based on quality profile inspection. Omit to disable truncation.--p-trim-left-fand--p-trim-left-r: Number of bases to remove from the 5' start of reads, often to remove primer remnants.--p-n-threads: Number of cores to use for parallel processing.
- Outputs: The action produces three key artifacts: a
FeatureTable[Frequency],FeatureData[Sequence](representative sequences), and aSampleData[DADA2Stats]denoising statistics file.
Protocol B: Denoising with Deblur for Single-End Reads
This protocol requires pre-joined or single-end reads of a uniform length [31] [23].
- Import & Join Reads (if paired-end): For paired-end data, first join reads using
qiime vsearch join-pairs, then filter for quality withqiime quality-filter q-score-joined. - Denoise: Run
qiime deblur denoise-16S(for 16S data) ordenoise-other(for other markers).--i-demultiplexed-seqs: Input the quality-filtered, joined sequences.--p-trim-length: The mandatory length to which all sequences will be trimmed. Use-1to disable, but this is not recommended.
- Outputs: Similar to DADA2, this generates a
FeatureTable[Frequency],FeatureData[Sequence], and aSampleData[DeblurStats]stats file.
Protocol C: Taxonomic Assignment with a Pre-trained Classifier
This is a standardized workflow for assigning taxonomy to your representative sequences [32].
- Classifier Selection: Download a pre-trained classifier compatible with your QIIME 2 version and gene region from the QIIME 2 Data Resources page.
- Run Classification: Execute
qiime feature-classifier classify-sklearn.--i-reads: Your representative sequences (FeatureData[Sequence]).--i-classifier: The pre-trained classifier artifact.--o-classification: The output taxonomy assignments.
- Output: The result is a
FeatureData[Taxonomy]artifact, which can be merged with the feature table for downstream analyses and visualizations, such as creating bar plots.
Table 3: Key Resources for QIIME2 Amplicon Analysis
| Resource Name / Plugin | Category | Primary Function in Workflow |
|---|---|---|
| q2-dada2 | Denoising Plugin | Denoises single-end, paired-end, and PacBio CCS reads into ASVs using a parametric error model [31] [33]. |
| q2-deblur | Denoising Plugin | Denoises quality-filtered single-end reads into ASVs using positive abundance-aware filtering [31] [33]. |
| q2-feature-classifier | Classification Plugin | Assigns taxonomy to feature sequences using methods like classify-sklearn (Naive Bayes) against a reference database [34] [33]. |
| q2-demux / q2-cutadapt | Preprocessing Plugin | Demultiplexes raw sequence data and removes primers/adapters [30] [31]. |
| q2-vsearch | Utility Plugin | Joins paired-end reads (pre-Deblur) and performs reference-based OTU clustering and chimera filtering [30] [33]. |
| Silva / Greengenes2 / GTDB | Reference Database | Curated collections of reference sequences and taxonomies used for training classifiers and taxonomic assignment [32]. |
| Pre-trained Classifiers | Data Resource | Ready-to-use .qza files containing a classifier and reference database, version-matched for immediate use with q2-feature-classifier [32]. |
The choice between DADA2 and Deblur is not a matter of one being universally superior, but rather which is more appropriate for a given study's goals and data type. DADA2 offers a more integrated workflow for paired-end data, does not impose a uniform sequence length, and typically yields a higher resolution of ASVs, which may be crucial for strain-level analyses. Deblur provides a stringent, uniform-length approach that can be advantageous for consistency and may reduce the potential for spurious, over-split variants. Critically, empirical evidence suggests that while the absolute numbers of sequences and ASVs can differ dramatically, the broader ecological patterns often converge [23]. This convergence is reassuring for the reproducibility of high-level biological findings. Ultimately, researchers should align their tool choice with their specific research questions, declare their bioinformatic parameters with transparency, and utilize version-controlled, pre-trained resources like taxonomic classifiers to ensure that their microbiome analyses are both robust and reproducible.
The MOTHUR Standard Operating Procedure (SOP) for OTU Clustering
Operational Taxonomic Unit (OTU) clustering is a foundational step in 16S rRNA gene analysis, grouping sequences based on similarity to reduce data complexity and infer taxonomic units. The MOTHUR platform provides multiple algorithms for this critical bioinformatics task, with its Standard Operating Procedure (SOP) representing a comprehensive workflow for processing amplicon sequence data from raw reads through community analysis [35]. MOTHUR primarily employs traditional OTU-based approaches where sequences are clustered at a 97% similarity threshold, contrasting with more recent Amplicon Sequence Variant (ASV) methods that resolve sequences to single-nucleotide differences [13]. This clustering process transforms raw sequence data into biological insights about microbial community structure, diversity, and composition, forming the basis for downstream ecological analyses.
MOTHUR's Clustering Algorithms and Methodologies
Core Clustering Methods
MOTHUR implements several clustering algorithms, each with distinct approaches to defining OTU boundaries:
- OptiClust (opti): The default algorithm that assembles OTUs using metrics to determine clustering quality through an iterative optimization process that seeks to maximize the similarity within clusters and minimize similarity between clusters [36].
- Nearest neighbor (nearest): Implements a liberal clustering approach where each sequence within an OTU is at most X% distant from the most similar sequence in the OTU, potentially creating larger, more inclusive OTUs [36].
- Furthest neighbor (furthest): Employs a conservative strategy requiring all sequences within an OTU to be at most X% distant from all other sequences in the same OTU, resulting in smaller, more stringent OTUs [36].
- Average neighbor (average): Represents a middle ground between nearest and furthest neighbor approaches, balancing the trade-offs between the two extreme clustering philosophies [36].
- Abundance-based greedy clustering (agc) and Distance-based greedy clustering (dgc): Greedy clustering algorithms that provide alternative heuristic approaches to OTU formation [36].
- Unique (unique): Creates a list file where every unique sequence is assigned to its own OTU, effectively generating Amplicon Sequence Variants without clustering [36].
The OptiClust Advantage
OptiClust represents MOTHUR's sophisticated clustering implementation, using an algorithm that compares different clustering solutions through an iterative process. It evaluates clustering quality using metrics including sensitivity, specificity, positive predictive value (PPV), and the Matthews correlation coefficient (MCC) [36]. The algorithm runs through multiple iterations, with output displaying progressive refinement of these metrics until optimal clustering is achieved. When using OptiClust, researchers should cite the dedicated publication by Westcott and Schloss (2017) that established its improved performance over traditional methods [36].
OTU Fitting with Cluster.fit
For projects requiring consistent OTU definitions across datasets, MOTHUR offers the cluster.fit command with two operational modes:
- Closed reference fitting: Forces all reads into existing OTU definitions, discarding any sequences that cannot be matched to reference OTUs [37].
- Open reference fitting: Allows unmatched reads to form new OTUs alongside the reference OTUs, providing flexibility while maintaining consistency for the majority of sequences [37].
This functionality is particularly valuable for longitudinal studies and multi-study comparisons where maintaining consistent OTU definitions across sampling events or research projects is methodologically critical.
Performance Comparison with Alternative Pipelines
Methodological Comparison Framework
Recent benchmarking studies have evaluated MOTHUR against other popular bioinformatics pipelines using both mock communities with known composition and large clinical datasets to assess real-world performance. These comparisons typically evaluate pipelines across multiple dimensions including sensitivity (ability to detect true positives), specificity (ability to avoid false positives), and quantitative accuracy in estimating microbial abundances [13]. The fundamental methodological division lies between OTU-based approaches like MOTHUR's traditional clustering and ASV-based methods like DADA2 and UNOISE3 that resolve exact sequences without clustering.
Table 1: Pipeline Methodological Approaches and Characteristics
| Pipeline | Clustering Unit | Primary Method | Key Characteristics |
|---|---|---|---|
| MOTHUR | OTU | Distance-based clustering (OptiClust) | Multiple algorithm options; alignment-based; comprehensive workflow |
| QIIME-uclust | OTU | Heuristic clustering | Older approach; produces spurious OTUs [13] |
| USEARCH-UPARSE | OTU | Greedy clustering | Good performance but lower specificity than ASV methods [13] |
| DADA2 | ASV | Statistical error correction | Highest sensitivity; decreased specificity [13] |
| Qiime2-Deblur | ASV | Error correction | Intermediate sensitivity/specificity balance [13] |
| USEARCH-UNOISE3 | ASV | Error correction | Best balance between resolution and specificity [13] |
Quantitative Performance Metrics
Independent comparative studies provide empirical data on how MOTHUR performs relative to other pipelines. A 2020 analysis by Prodan et al. evaluated six bioinformatic pipelines on a mock community with known composition and a large fecal sample dataset (N=2170), revealing important performance differences [13].
Table 2: Performance Comparison Across Bioinformatics Pipelines
| Pipeline | Sensitivity | Specificity | Spurious OTUs/ASVs | Alpha-Diversity Inflation |
|---|---|---|---|---|
| MOTHUR | Moderate | Moderate | Low | Minimal |
| QIIME-uclust | Moderate | Low | High | Inflated [13] |
| USEARCH-UPARSE | Moderate | Moderate | Low | Minimal |
| DADA2 | Highest | Lower | Moderate | Minimal |
| Qiime2-Deblur | High | High | Low | Minimal |
| USEARCH-UNOISE3 | High | Highest | Lowest | Minimal |
These performance characteristics directly impact biological interpretations. For instance, the tendency of QIIME-uclust to generate spurious OTUs and inflate alpha-diversity measures could lead to erroneous ecological conclusions about microbial diversity [13]. MOTHUR demonstrates reliable performance with moderate sensitivity and specificity, producing fewer spurious OTUs than QIIME-uclust while offering more traditional OTU-based analysis compared to ASV methods.
Reproducibility Across Platforms
A critical consideration for clinical and translational research is method reproducibility. A 2025 study comparing microbiome analysis pipelines across five independent research groups found that MOTHUR, DADA2, and QIIME2 generated comparable results for major biological patterns despite differences in their underlying algorithms [1]. Specifically, Helicobacter pylori status, microbial diversity, and relative abundance of major taxa were reproducibly identified across all platforms when applied to the same gastric biopsy dataset [1]. This reproducibility across independent implementations underscores the robustness of well-established pipelines like MOTHUR for identifying key biological signals.
Experimental Protocols and Methodologies
Standard MOTHUR SOP Workflow
The MOTHUR SOP for MiSeq data represents a comprehensive protocol for processing 16S rRNA gene sequences from raw sequencing reads through OTU clustering and analysis [35]. The workflow proceeds through several methodical stages:
Figure 1: MOTHUR SOP workflow for OTU clustering and analysis.
Sequence Processing and Quality Control
The initial stages focus on sequence quality and data integrity:
- Make.contigs: Processes paired-end reads by extracting sequence and quality score data from FASTQ files, creating reverse complements of reverse reads, and joining reads into contigs using a quality-aware algorithm that resolves disagreements between forward and reverse reads [35].
- Alignment (align.seqs): Aligns sequences against a reference alignment (typically SILVA) using a positional homology approach to ensure accurate comparison across the targeted gene region [35] [38].
- Filtering (screen.seqs): Removes sequences that are too short, too long, or contain ambiguous base calls, followed by removal of redundant sequences to reduce computational burden [35].
- Chimera Removal: Identifies and removes PCR artifacts using algorithms like VSEARCH or ChimeraSlayer that detect chimeric sequences formed during amplification [35].
Distance Calculation and Clustering
The core OTU clustering process involves:
- Distance Matrix (dist.seqs): Calcules pairwise distances between aligned sequences, producing either column or phylip-formatted matrices that quantify sequence dissimilarity [36] [39].
- OTU Clustering (cluster): Groups sequences into OTUs using the selected algorithm (default: OptiClust) at a specified cutoff (typically 0.03, equivalent to 97% similarity) [36].
Benchmarking Methodologies
Comparative studies employ standardized evaluations to assess pipeline performance:
- Mock Community Analysis: Uses defined consortia of known bacterial strains (e.g., Microbial Mock Community B) with predetermined composition and abundance ratios to measure accuracy in taxonomic assignment and quantitative representation [13].
- Large Clinical Datasets: Applies pipelines to extensive sample collections (e.g., N=2170 in the HELIUS study) to evaluate performance on realistic, complex microbial communities and assess computational efficiency [13].
- Cross-Platform Validation: Implements identical datasets across multiple independent research groups to measure reproducibility and identify platform-specific biases [1].
The Researcher's Toolkit: Essential Components
Computational Tools and Algorithms
Table 3: Essential Research Tools for MOTHUR OTU Clustering
| Tool/Resource | Function | Application in MOTHUR |
|---|---|---|
| SILVA Database | Reference alignment | Provides curated 16S rRNA sequence alignment for positional homology [35] [38] |
| RDP Training Set | Taxonomic classification | Enables Bayesian classification of sequences into taxonomic groups [35] |
| OptiClust Algorithm | OTU clustering | Default clustering method that optimizes OTU quality metrics [36] |
| VSEARCH | Chimera detection | Identifies and removes PCR artifacts from sequence data [35] |
| Distance Matrix | Sequence comparison | Quantifies pairwise differences between sequences for clustering [36] |
Critical Experimental Considerations
Successful implementation of MOTHUR OTU clustering requires attention to several methodological factors:
- Region Selection: The V4 region with 250bp paired-end reads provides optimal overlap and error correction; deviation from this standard region requires custom reference alignment using
pcr.seqswith specific start and end coordinates [38]. - Quality Control: Stringent filtering parameters including minimum length requirements, maximum homopolymer lengths, and minimum quality scores dramatically impact downstream results [35].
- Reference Alignment: Proper alignment using the SILVA database with region-specific trimming ensures positional homology across sequences, a critical requirement for accurate distance calculation [38].
- Algorithm Selection: Choice of clustering algorithm (OptiClust vs. traditional methods) affects OTU quality and biological interpretations, with OptiClust generally providing superior performance [36].
Implications for Microbiome Research Reproducibility
The comparative performance of MOTHUR and alternative pipelines has significant implications for cross-study comparisons and clinical translation of microbiome research. While different pipelines show high concordance for major biological patterns (e.g., H. pylori detection) [1], quantitative differences in relative abundance estimates necessitate caution when comparing absolute values across studies using different bioinformatic approaches [2]. This methodological variability underscores the importance of pipeline documentation and methodological transparency in publications to enable proper interpretation and replication of findings.
MOTHUR's comprehensive implementation of multiple clustering algorithms, combined with its extensive quality control and downstream analysis tools, provides researchers with a versatile platform for OTU-based microbial community analysis. While ASV-based methods offer alternative approaches with potential advantages in resolution, MOTHUR's established performance, reproducibility across platforms, and continuous algorithm improvements like OptiClust maintain its relevance in the evolving landscape of microbiome bioinformatics.
In the standardized analysis of 16S rRNA sequencing data within bioinformatics pipelines like DADA2, MOTHUR, and QIIME2, the choice of reference database is a critical parameter that directly impacts taxonomic assignment and subsequent biological interpretation. The selection between commonly used databases such as SILVA, Greengenes, and the Ribosomal Database Project (RDP) introduces a source of variation that must be understood to ensure reproducible research, particularly in translational and drug development contexts. Evidence confirms that "the choice of taxonomic database can influence the results of a microbiota study at the genus level, potentially affecting the interpretation of the results" [40]. This guide objectively compares these three major databases by synthesizing experimental data from comparative studies, providing researchers with a evidence-based framework for selection.
Database Origins, Curation, and Characteristics
The SILVA, Greengenes, and RDP databases differ fundamentally in their scope, curation methodologies, and update frequency, leading to distinct structural characteristics.
SILVA provides a comprehensive, manually curated resource for ribosomal RNA data across Bacteria, Archaea, and Eukarya, with taxonomy primarily based on phylogenies for small subunit rRNAs and aligned with Bergey's Taxonomic Outlines and the List of Prokaryotic Names with Standing in Nomenclature [41]. Its taxonomy is manually curated and regularly updated [41].
Greengenes, dedicated to Bacteria and Archaea, employs an automated approach using de novo tree construction followed by rank mapping from other taxonomy sources, primarily NCBI [41]. A significant limitation is that Greengenes "has not been updated since 2013, potentially leading to studies presenting less accurate results" compared to continuously maintained databases [40].
The RDP database draws its taxonomy from 16S rRNA sequences available from international nucleotide sequence databases, with names obtained from the most recently published synonym via Bacterial Nomenclature Up-to-Date, and taxonomic information based on Bergey's Trust roadmaps and LPSN [41].
Table 1: Fundamental Characteristics of Major Taxonomic Databases
| Characteristic | SILVA | Greengenes | RDP |
|---|---|---|---|
| Taxonomic Scope | Bacteria, Archaea, Eukarya | Bacteria, Archaea | Bacteria, Archaea, Fungi |
| Primary Source | SSU rRNA phylogenies | Automated tree construction + NCBI mapping | INSDC sequences + Bergey's |
| Curation Approach | Manual curation | Automated | Mixed |
| Update Status | Regularly updated | Not updated since 2013 | Updated |
| Size Comparison | Largest [40] | Smallest [40] | Intermediate [40] |
Experimental Comparisons of Classification Performance
Recall and Precision Benchmarking
A comprehensive independent benchmarking study evaluated the performance of taxonomic classifiers using simulated 16S rRNA sequences representing human gut, ocean, and soil environments. The results demonstrated clear database-specific effects on classification accuracy when paired with different analysis tools [42].
Recall and Precision Metrics:
- QIIME 2 with SILVA achieved the highest recall (sensitivity) for human gut (67.0%) and soil samples (68.3%) at the genus level [42].
- QIIME 2 with Greengenes achieved the highest recall for the oceanic microbiome (79.5%) [42].
- MAPseq showed the highest precision across all databases, with miscall rates consistently below 2% [42].
- SILVA generally provided higher recall than Greengenes in most comparisons (five out of nine across tools) [42].
Table 2: Performance Metrics for Database-Tool Combinations in Taxonomic Classification
| Tool-Database Combination | Highest Genus Recall by Biome | Precision | Computational Performance |
|---|---|---|---|
| QIIME 2 + SILVA | Human gut: 67.0%, Soil: 68.3% [42] | Moderate | Most expensive: ~30x more memory than MAPseq [42] |
| QIIME 2 + Greengenes | Ocean: 79.5% [42] | Moderate | Most expensive: ~30x more memory than MAPseq [42] |
| MAPseq + SILVA | Detected greatest number of expected genera in all three biomes [42] | Highest (<2% miscall rate) [42] | Best performance: Lowest CPU and memory [42] |
Impact on Relative Abundance and Differential Abundance Findings
The choice of database directly influences abundance estimates and the identification of differentially abundant taxa, as demonstrated in a study of chicken cecal microbiota using QIIME 2 with different databases [40].
Key Findings:
- SILVA provided more specific classifications for the family Lachnospiraceae, distinguishing multiple genera that Greengenes and RDP grouped as "unclassified Lachnospiraceae" [40].
- This improved resolution led to significantly lower relative abundance of unclassified Lachnospiraceae in SILVA results compared to RDP [40].
- In Linear Discriminant Analysis Effect Size (LEfSe) analyses, SILVA produced more differentially abundant genera, primarily due to its finer classification of Lachnospiraceae members [40].
- Cross-referencing of feature IDs confirmed that "different classifications were being produced by the databases for identical DNA sequences" [40].
Database Selection Guidelines for Research Applications
Decision Framework Based on Research Goals
The optimal database choice depends on the specific research context, experimental questions, and technical constraints. The following diagram illustrates the decision pathway for database selection:
Recommendations for Specific Research Contexts
For maximal taxonomic resolution and contemporary research: "The use of the SILVA database is recommended over Greengenes in chicken microbiota studies, as more specific classifications at the genus level may provide more accurate interpretations of changes in the microbiota" [40]. This applies broadly to human microbiome studies and other systems where fine taxonomic discrimination is critical.
For cross-study comparability with existing literature: Greengenes may be necessary when comparing results with older studies that used this database, despite its outdated status [40]. However, researchers should acknowledge the limitation that "Greengenes is still included in some metagenomic analyses packages, for example QIIME, it has not been updated for the last three years" [41].
For computational efficiency: While all databases showed similar computational performance within the same tool, RDP represents a middle ground with regular updates and reasonable classification performance [42] [40].
Experimental Protocols for Database Comparison
Methodology for Cross-Database Validation Studies
The experimental approach for comparing database performance typically follows a standardized workflow to ensure fair comparisons:
Key Experimental Steps:
Sequence Processing: "Demultiplexed, paired-end sequence data is denoised with DADA2 via the q2-dada2 plugin using a quality cutoff" to generate amplicon sequence variants (ASVs) [40].
Classifier Training: "Feature classifiers for each database are trained with q2-feature-classifier fit-classifier-naive-bayes using the Greengenes 13_8 97% OTUs reference sequences and taxonomy, the RDP Release 11 unaligned Bacteria 16S reference sequences and taxonomy, and the SILVA 138 99% OTUs reference sequences and taxonomy" [40].
Taxonomic Assignment: "Taxonomy is assigned to amplicon sequence variants (ASVs) using the q2-feature-classifier classify-sklearn naïve Bayes taxonomy classifier" with each database [40].
Data Analysis: "Feature tables are collapsed to the genus taxonomic level via q2-taxa, where ASV counts are normalized by total sum scaling normalization" for cross-database comparison [40].
Research Reagent Solutions: Essential Materials for Database Comparison Studies
Table 3: Key Research Reagents and Computational Tools for Database Comparisons
| Resource Type | Specific Examples | Function in Database Comparison |
|---|---|---|
| Bioinformatic Platforms | QIIME 2, MOTHUR, DADA2 [1] | Provide standardized environments for processing 16S rRNA data with different databases |
| Reference Databases | SILVA 138, Greengenes 13_8, RDP Release 11 [40] | Sources of taxonomic classifications for sequence assignment |
| Analysis Plugins | q2-feature-classifier, RESCRIPt [40] | Enable database-specific classifier training and taxonomy assignment |
| Validation Tools | LEfSe, ANCOM, ALDEx2 [40] | Identify differentially abundant taxa across database results |
| Quality Control Tools | Bowtie2, DADA2 denoising [43] | Ensure input sequence quality before database-specific processing |
The selection of taxonomic databases significantly impacts microbiome analysis outcomes, particularly at the genus level, with SILVA generally providing higher resolution and more updated classifications, while Greengenes offers backward compatibility at the cost of being outdated. RDP represents a balanced intermediate option. For reproducible research, especially in clinical and translational contexts, the database selection should be explicitly justified and consistently applied throughout a study. Methodological reporting should include the specific database name, version, and classification parameters to enable proper interpretation and replication. As the field evolves, continued benchmarking of these resources against mock communities and clinical outcomes remains essential for validating their utility in explaining biological phenomena.
Microbiome research has revolutionized our understanding of microbial communities in human health and disease, with 16S rRNA amplicon sequencing serving as a fundamental methodological approach. The analytical journey from raw sequencing data to biological insights requires sophisticated bioinformatic pipelines, with QIIME2, DADA2, and mothur representing the most widely utilized platforms. However, studies have demonstrated that the choice of bioinformatic pipeline significantly influences taxonomic classification and relative abundance estimates, creating substantial challenges for cross-study comparisons and reproducibility [2]. This variability stems from fundamental methodological differences—while QIIME2 and Bioconductor implement amplicon sequence variant (ASV) approaches using algorithms like DADA2 and Deblur that resolve sequences down to single-nucleotide differences, UPARSE and mothur traditionally utilize operational taxonomic units (OTUs) that bin sequences with typically less than 3% variance [2]. These technical differences manifest in clinically relevant contexts, as evidenced by a 2023 study on salivary microbiota in pulmonary nodule patients where pipeline selection directly impacted the identification of potential biomarkers [44].
The reproducibility crisis in microbiome research extends beyond algorithmic differences to encompass usability barriers. Most computational pipelines require implementation of additional tools for downstream analyses alongside advanced programming skills, creating accessibility challenges for researchers with limited bioinformatics expertise [45]. This expertise barrier not only limits who can conduct analyses but also introduces variability through inconsistent parameter settings and workflow documentation. Within this landscape, EzMAP (Easy Microbiome Analysis Platform) emerges as a solution designed to bridge the accessibility gap while maintaining analytical rigor through its streamlined implementation of QIIME2 functionalities.
EzMAP Platform Analysis: Architecture and Implementation
EzMAP represents a comprehensive standalone package developed using Java Swings, JavaScript, and R programming language that provides an intuitive graphical user interface for microbiome analysis [45]. Its architectural design consolidates the entire microbiome analysis process from raw sequence processing to project-specific downstream analyses, effectively addressing the fragmentation that often plagues bioinformatic workflows. The platform is specifically engineered to eliminate the burden of command-line usage, which is particularly prone to errors resulting from typos and parameter setting inconsistencies [45]. This user-centered design philosophy makes sophisticated QIIME2 functionalities accessible to researchers across computational skill levels.
The implementation of EzMAP follows a modular approach that guides users through a logical analytical progression. The platform supports comprehensive analysis of both 16S rRNA and ITS marker gene datasets through several interconnected modules:
- Data Import and Quality Control: Users upload manifest files (paths to FASTQ files) and metadata files, with automatic validation for proper file format
- Sequence Processing: Choice between DADA2 and Deblur algorithms for quality control and denoising
- Taxonomic Classification: Options for SILVA, Greengenes, or UNITE databases with default 97% similarity and 70% confidence thresholds
- Downstream Analysis: Integrated capabilities for relative abundance analysis, community comparisons, differential abundance testing, and functional prediction [45]
A particularly innovative aspect of EzMAP's implementation is its flexible deployment strategy. The platform can run natively on Linux and Mac operating systems without Docker containers, while Windows implementation utilizes Docker containers to ensure cross-platform compatibility [45]. This thoughtful approach to deployment substantially lowers the technical barrier to entry, as EzMAP combines all necessary packages and tools to perform microbiome analysis, thereby helping users avoid complicated and time-consuming installations that frequently derail analytical workflows before they begin.
Table 1: EzMAP Platform Specifications and Requirements
| Component | Specification | Function |
|---|---|---|
| Architecture | Java Swings, JavaScript, R | Provides graphical interface and analytical backend |
| QIIME2 Integration | Full implementation with algorithm options | Executes core microbiome analysis functions |
| Deployment Options | Native (Linux/Mac) or Docker (Windows) | Ensures cross-platform compatibility |
| Reference Databases | SILVA, Greengenes, UNITE | Supports taxonomic classification |
| Denoising Algorithms | DADA2 or Deblur | Performs sequence quality control and error correction |
Workflow Architecture and Integration
The EzMAP workflow follows a logical progression from raw data to biological insights, with careful attention to provenance tracking and reproducibility. Upon launching the platform through a simple double-click on the EzMAP.jar file, users encounter an intuitive interface that guides them through the analytical process [46]. For upstream analysis, users select sequencing read types (single-end or paired-end), provide working directories, and upload manifest and metadata files. The platform then executes sequence import, adapter trimming via cutadapt, and quality assessment through interactive plots that inform subsequent trimming and truncation parameters [46].
A critical design strength of EzMAP is its implementation of multiple denoising algorithms, allowing users to select between DADA2 and Deblur based on their specific research needs. Following denoising, non-chimeric sequences are searched against reference databases using a Naive Bayes classifier with modifiable similarity and confidence thresholds [45]. The platform employs MAFFT for multiple sequence alignment and phylogenetic tree construction, ultimately generating feature tables, representative sequences, and taxonomy assignments in standardized formats (.biom, .fasta, .nwk) that facilitate both within-platform downstream analysis and external validation [45].
Comparative Performance Analysis: Experimental Evidence
The critical question in pipeline selection centers on how platform choices influence analytical outcomes. A comprehensive 2020 study directly addressed this concern by comparing four bioinformatics pipelines (QIIME2, Bioconductor, UPARSE, and mothur) run on two operating systems (Linux and Mac) to evaluate their impact on taxonomic classification of 40 human stool samples [2]. This experimental design provided robust evidence regarding both pipeline consistency and operating system effects, with all analyses utilizing the SILVA 132 reference database to isolate pipeline-specific effects.
The findings revealed that while taxa assignments were generally consistent at both phylum and genus levels across all pipelines, statistically significant differences emerged in relative abundance estimates. Specifically, the investigation identified significant differences for all phyla (p < 0.013) and for the majority of the most abundant genera (p < 0.028) [2]. For instance, the genus Bacteroides showed considerable variation in relative abundance across platforms: QIIME2 reported 24.5%, Bioconductor 24.6%, UPARSE-Linux 23.6%, UPARSE-Mac 20.6%, mothur-Linux 22.2%, and mothur-Mac 21.6% (p < 0.001) [2]. These results demonstrate that pipeline selection introduces systematic variation that could potentially influence biological interpretations.
Table 2: Comparative Pipeline Performance Based on Experimental Data
| Analysis Metric | QIIME2 | Bioconductor | UPARSE | mothur |
|---|---|---|---|---|
| OS Dependence | None | None | Minimal | Minimal |
| Bacteroides Abundance | 24.5% | 24.6% | 22.1% (avg) | 21.9% (avg) |
| Methodological Approach | ASV (DADA2/Deblur) | ASV | OTU (97% similarity) | OTU (97% similarity) |
| Reproducibility | High (provenance tracking) | Moderate | Moderate | Moderate |
| Usability | Moderate (command-line) | Moderate (programming) | Moderate (command-line) | Moderate (command-line) |
Operating system variability presented another dimension of analytical uncertainty. While QIIME2 and Bioconductor provided identical outputs on Linux and Mac OS, UPARSE and mothur reported minimal differences between operating systems [2]. This finding suggests that ASV-based approaches (employed by QIIME2 and Bioconductor) may offer greater computational stability across platforms compared to traditional OTU-based methods, though all pipelines showed some degree of operational consistency.
The practical implications of these technical differences manifest clearly in clinical research settings. A 2023 investigation of salivary microbiota characteristics in patients with pulmonary nodules utilized QIIME2 (version 2022.2) with DADA2 for denoising and the SILVA 138 database for taxonomic classification [44]. The study successfully identified significant differences in alpha and beta diversity between patient and control groups (P < 0.05), and developed a predictive model based on differential taxa (Porphyromonas, Haemophilus, and Fusobacterium) that achieved an AUC of 0.79 for distinguishing pulmonary nodule cases [44]. This demonstrates that despite methodological variations across platforms, robust biomarker discovery remains achievable within consistent analytical frameworks.
Experimental Protocols and Methodologies
Sample Processing and Sequencing
The foundational evidence supporting pipeline comparisons derives from standardized experimental protocols. In the comparative pipeline study [2], researchers collected stool samples from 40 participants with cognitive performance ranging from normal to dementia. DNA extraction followed rigorous protocols using the QIAamp DNA Stool Mini Kit with bead-beating homogenization by TissueLyser II to mechanically disrupt fecal samples [2]. Quantification utilized NanoDrop ND-1000 spectrophotometry, ensuring consistent DNA quality across samples.
Amplification targeted the V3 and V4 regions of the bacterial 16S rRNA gene using Illumina-specified primers and cycling conditions (95°C for 3'; 25 cycles of: 95°C for 30″, 55°C for 30″, 72°C for 30″; 72°C for 5′) [2]. Following amplification, researchers purified amplicon DNA using magnetic beads, performed dual-indexing with Nextera XT indices, and conducted a second purification before quantification via fluorometric methods (Qubit) and fragment analysis (Bioanalyzer DNA 1000 chip). The final pooled, denatured libraries were sequenced on the Illumina MiSeq platform using v3 cartridges [2], establishing a robust foundation for subsequent bioinformatic comparisons.
Bioinformatic Analysis Framework
The analytical methodology for pipeline comparison maintained consistency where possible while respecting platform-specific requirements. All pipelines utilized the SILVA 132 reference database to isolate the effects of analytical algorithms from database variation [2]. For the QIIME2 implementation, which forms the analytical core of EzMAP, the process encompassed several critical stages:
Sequence Quality Control and Denoising: Raw sequences underwent quality filtering, denoising, and chimera removal using DADA2 [44], resulting in amplicon sequence variants (ASVs) rather than traditional OTUs
Taxonomic Assignment: ASVs were classified using the classify-sklearn (Naive Bayes) algorithm with a classification confidence threshold of 0.7 [44]
Data Normalization: All samples were rarefied to 10,000 sequences per sample to standardize sequencing depth for diversity analyses [44]
Diversity Analysis: Alpha diversity metrics were computed using mothur software, while beta diversity utilized principal coordinates analysis (PCoA) based on Bray-Curtis dissimilarity [44]
This methodological framework ensured that observed differences reflected genuine pipeline characteristics rather than parameter selection variations, providing a fair comparative assessment.
Statistical Analysis Approaches
Robust statistical frameworks supported the comparative pipeline evaluations. For the pipeline comparison study [2], researchers used the Friedman rank sum test to compare taxa identification and relative abundances across the four pipelines, appropriately addressing the non-parametric nature of microbiome data. In the pulmonary nodule study [44], statistical analysis employed SPSS 26.0 software, with continuous variables compared using Student's t-test (normal distribution) or Wilcoxon rank-sum test (non-normal distribution), and categorical variables analyzed via chi-square tests. The false discovery rate (FDR) method corrected for multiple comparisons, with statistical significance established at P < 0.05 [44].
For biomarker identification, the pulmonary nodule study utilized linear discriminant analysis effect size (LEfSe) to identify differentially abundant taxa (LDA > 3, P < 0.05) and random forest algorithms to evaluate predictive performance through AUC calculations [44]. This multi-faceted statistical approach provided comprehensive assessment of both taxonomic differences and clinical utility.
Table 3: Essential Research Reagent Solutions for Microbiome Analysis
| Resource | Function | Application in EzMAP |
|---|---|---|
| QIAamp DNA Stool Mini Kit | Microbial DNA extraction from stool samples | Sample preparation prior to analysis |
| SILVA Database | Taxonomic reference database for 16S rRNA sequences | Default reference database for taxonomic classification |
| Greengenes Database | Alternative 16S rRNA reference database | Optional database for taxonomic classification |
| UNITE Database | Reference database for ITS fungal sequences | Fungal microbiome analysis |
| DADA2 Algorithm | Error correction and ASV inference | Denoising option for sequence processing |
| Deblur Algorithm | Error correction and ASV inference | Alternative denoising option |
| PICRUSt2 | Functional prediction from 16S data | Downstream functional analysis |
| LEfSe | Differential abundance analysis | Identification of biomarker taxa |
Successful microbiome analysis requires both computational resources and wet-laboratory reagents. For DNA extraction, the QIAamp DNA Stool Mini Kit has demonstrated efficacy in multiple studies [2], providing high-quality microbial DNA for subsequent amplification. For sequencing, Illumina's MiSeq platform with v3 reagents supports the recommended 2×300 bp paired-end sequencing that adequately covers the V3-V4 hypervariable regions of the 16S rRNA gene [2].
Computational resources extend beyond analytical pipelines to encompass reference databases that enable taxonomic classification. The SILVA database (version 138) provides comprehensive, quality-checked ribosomal RNA sequence data that serves as EzMAP's default reference [44], though the platform also supports Greengenes and UNITE databases for expanded taxonomic coverage. For functional inference, PICRUSt2 enables prediction of metagenomic potential from 16S rRNA data, extending the biological insights possible from amplicon sequencing approaches [45].
The comparative evidence demonstrates that while bioinformatic pipeline selection introduces systematic variation in taxonomic abundance estimates, platforms like EzMAP that implement QIIME2 functionalities offer a balanced solution combining analytical robustness with accessibility. The significant differences in relative abundance estimates across pipelines [2] underscore the critical importance of maintaining methodological consistency within research consortia and across longitudinal studies. Furthermore, the operating system independence demonstrated by QIIME2 [2] enhances reproducibility across computational environments.
EzMAP addresses two fundamental challenges in microbiome bioinformatics: technical accessibility and analytical reproducibility. By providing a user-friendly graphical interface that maintains the analytical rigor of QIIME2, the platform expands access to sophisticated microbiome analysis while reducing errors associated with command-line implementations [45]. The integrated provenance tracking through QIIME2's artifact system [47] automatically documents analytical steps, parameters, and software versions, directly addressing reproducibility concerns that have plagued bioinformatics research [48].
For the research community, EzMAP represents a pragmatic solution to the tension between analytical sophistication and practical accessibility. As microbiome science increasingly transitions toward clinical applications, platforms that standardize analytical approaches while maintaining flexibility for research-specific questions will be essential for generating comparable, reproducible evidence across studies and institutions. EzMAP's consolidation of upstream processing and downstream analysis within a single, documented environment offers a promising framework for advancing this goal, particularly for researchers with limited bioinformatics support.
Troubleshooting Pipeline Performance and Optimizing for Robust Results
In microbiome research, the choice of bioinformatics pipeline is critical, balancing analytical accuracy with practical computational demands. As studies grow in scale, understanding the execution time and resource requirements of different tools becomes essential for feasible and reproducible research. This guide objectively compares the computational performance of three widely used microbiome analysis pipelines—DADA2, MOTHUR, and QIIME2—within the broader context of a reproducibility comparison study. We provide researchers, scientists, and drug development professionals with experimental data on computational efficiency, practical optimization strategies, and evidence that robust results can be achieved across platforms despite their technical differences.
Performance Comparison of Microbiome Pipelines
A 2025 comparative study directly evaluated DADA2, MOTHUR, and QIIME2 using the same dataset of 16S rRNA gene sequences from gastric biopsy samples. Independent research groups applied these pipelines to analyze identical raw sequencing files (V1-V2 hypervariable region) from 79 total samples (40 gastric cancer patients and 39 controls) [1] [49].
The key finding was that all three pipelines produced reproducible and comparable results for Helicobacter pylori status, microbial diversity, and relative bacterial abundance, despite differences in their underlying algorithms and processing approaches [1]. This reproducibility across platforms underscores their reliability for clinical research applications.
However, the study also noted detectable differences in performance characteristics, including computational efficiency [1]. The table below summarizes the comparative performance metrics based on empirical observations:
Table 1: Performance Comparison of DADA2, MOTHUR, and QIIME2
| Performance Metric | DADA2 | MOTHUR | QIIME2 |
|---|---|---|---|
| Primary Output | Amplicon Sequence Variants (ASVs) | Operational Taxonomic Units (OTUs) | OTUs or ASVs (via plugins) |
| Resolution | Single-nucleotide [50] | Cluster-based (e.g., 97% similarity) [27] | Varies by plugin |
| Computational Scaling | Linear with sample number [50] | Not fully specified | Not fully specified |
| Key Computational Challenge | Error rate learning can be resource-intensive [51] [52] | Not fully specified | Not fully specified |
Computational Challenges and Optimization Strategies
DADA2 Execution Time Considerations
A significant computational bottleneck in DADA2 is its sample inference process, particularly the error-rate learning step. Unlike traditional OTU-clustering methods, DADA2 builds an error model for each sequencing run, which is computationally intensive but crucial for achieving high accuracy [50] [52].
User reports highlight substantial variability in processing times. For typical 16S rRNA (V3-V4 region) datasets, DADA2 processed 36 samples (1.8 GB input) in approximately 2.5 hours on an Apple M3 Pro chip with 11 cores and 18 GB RAM [51]. However, another user reported an 8-sample dataset (5 GB input) running for over two weeks without completion, indicating that input file size and computational resources significantly impact performance [51].
Table 2: Documented DADA2 Processing Times for 16S rRNA Data
| Sample Count | Input File Size | Processing Time | Computational Resources |
|---|---|---|---|
| 36 samples | 1.8 GB | ~2.5 hours | Apple M3 Pro (11 cores, 18 GB RAM) |
| 1150 samples | ~20 GB | ~3 days | 75 threads [52] |
| 1200 samples | >20 GB | >10 days (incomplete) | 75 threads [52] |
| 8 samples | 5 GB | >2 weeks (incomplete) | Not specified [51] |
Strategies for Managing Computational Workloads
For large-scale analyses, these strategies can significantly improve DADA2 performance:
Process by sequencing run: DADA2 is designed to build error models for each sequencing run separately. Running samples from different sequencing runs together can dramatically increase processing times and lead to failures [52]. The recommended approach is to denoise samples from each run separately using consistent parameters, then merge the resulting feature tables and representative sequences [51] [52].
Split large datasets: For studies with unknown sequencing run information, artificially batching samples (e.g., 50-100 samples per batch) can improve performance. DADA2's output (ASVs) can be directly merged across batches, unlike traditional OTU tables [52].
Consider alternative algorithms: For extremely large datasets where DADA2 remains impractical despite optimization, Deblur provides a conservative alternative algorithm that omits the error-learning step and can process large sample sets more quickly [52].
Experimental Protocols for Performance Benchmarking
Reproducibility Assessment Methodology
The referenced comparative study employed this rigorous methodology [1]:
Sample Collection and Processing: Gastric biopsy samples were collected from clinically well-defined gastric cancer patients and controls, with and without H. pylori infection. DNA was extracted and the V1-V2 regions of the 16S rRNA gene were amplified and sequenced.
Pipeline Application: Five independent research groups processed the same subset of raw FASTQ files using DADA2, MOTHUR, and QIIME2 with their standard protocols.
Output Comparison: Results were compared across platforms for key metrics: H. pylori detection, microbial diversity (alpha and beta), and relative taxonomic abundance at different taxonomic levels.
Taxonomic Database Evaluation: The impact of different taxonomic databases (Ribosomal Database Project, Greengenes, and SILVA) on results was also assessed.
Workflow for Pipeline Comparison
The following diagram illustrates the experimental workflow for comparing bioinformatics pipelines:
The Scientist's Computational Toolkit
Essential Research Reagent Solutions
Table 3: Key Computational Resources for Microbiome Analysis
| Resource Category | Specific Tool/Option | Function in Analysis |
|---|---|---|
| Bioinformatics Pipelines | DADA2, MOTHUR, QIIME2 | Process raw sequencing data into interpretable microbial community data [1] |
| Taxonomic Databases | SILVA, Greengenes, RDP | Provide reference sequences for taxonomic classification of ASVs/OTUs [1] |
| Computational Environments | Galaxy Web Platform, Conda, Docker | Ensure reproducible environments and simplify installation dependencies [8] [27] |
| Analysis Frameworks | Phyloseq, Lotus2 | Enable statistical analysis and visualization of microbiome data [8] |
Emerging Alternatives and Optimized Tools
While this guide focuses on DADA2, MOTHUR, and QIIME2, researchers should be aware of emerging tools designed to address computational challenges:
LotuS2: Described as an "ultrafast and highly accurate tool for amplicon sequencing analysis," LotuS2 benchmarks show it can process data approximately 29 times faster than other pipelines while maintaining or improving accuracy in reproducing technical replicate diversity [8].
Minitax: A recently developed software tool that provides consistent results across different sequencing platforms and methodologies, demonstrating the ongoing evolution of efficient analysis tools [53].
The computational challenges of microbiome bioinformatics pipelines, particularly execution time and resource requirements, present significant considerations for research planning and implementation. While DADA2, MOTHUR, and QIIME2 all produce reproducible and comparable biological conclusions [1], they differ substantially in their computational characteristics.
DADA2 offers single-nucleotide resolution through ASVs but requires substantial computational resources for its error-modeling step, particularly with large datasets [51] [50] [52]. MOTHUR and QIIME2 provide established OTU-based approaches with their own performance profiles. By implementing strategic approaches such as processing by sequencing run, batching large datasets, and utilizing appropriate computational resources, researchers can effectively navigate these challenges while maintaining analytical rigor in microbiome studies.
Microbiome analysis has become a crucial tool for basic and translational research due to its significant potential for translation into clinical practice [1]. However, the field has faced ongoing controversy regarding the comparability of different bioinformatic analysis platforms and a lack of recognized standards, which can impact the translational potential of results [1]. This guide examines the critical role of parameter optimization in achieving reproducible results across three major microbiome analysis pipelines—DADA2, MOTHUR, and QIIME2—with a specific focus on tuning truncation length, error rates, and chimera removal methods.
A 2025 comparative study investigating the reproducibility of gastric mucosal microbiome composition found that while different microbiome analysis approaches from independent expert groups generate comparable results when applied to the same dataset, differences in performance can still be detected based on parameter selection [1]. The study demonstrated that Helicobacter pylori status, microbial diversity, and relative bacterial abundance were reproducible across all platforms regardless of the applied protocol [1]. This underscores the broader applicability of microbiome analysis in clinical research, provided that robust pipelines are utilized and thoroughly documented to ensure reproducibility.
Experimental Designs for Pipeline Comparison
Benchmarking Methodology and Experimental Protocols
Recent comparative studies have established rigorous methodologies for evaluating bioinformatics pipeline performance. A 2025 investigation into pipeline reproducibility involved five independent research groups applying three distinct microbiome analysis packages (DADA2, MOTHUR, and QIIME2) to the same subset of fastQ files [1]. The source dataset encompassed 16S rRNA gene raw sequencing data from gastric biopsy samples of clinically well-defined gastric cancer patients and controls, creating a robust benchmark for comparing parameter effects across platforms.
Another benchmarking effort evaluated the LotuS2 pipeline against established tools using three independent gut and soil datasets along with a mock community with known taxon composition [8]. This study employed critical performance metrics including processing speed, alpha- and beta-diversity reproduction in technical replicates, fraction of correctly identified taxa, fraction of reads assigned to true taxa, and precision/F-score at ASV/OTU level. The mock community with known composition provided ground truth validation, while technical replicates tested procedural consistency.
Table 1: Key Performance Metrics in Pipeline Comparisons
| Metric Category | Specific Metrics | Application in Evaluation |
|---|---|---|
| Accuracy Metrics | Fraction of correctly identified taxa; Reads assigned to true taxa | Validation against mock communities with known composition |
| Precision Metrics | F-score at ASV/OTU level; Precision | Assessment of variant calling accuracy |
| Reproducibility Metrics | Alpha-diversity; Beta-diversity | Consistency across technical replicates |
| Efficiency Metrics | Processing speed; Computational resource usage | Practical implementation assessment |
Research Reagent Solutions and Essential Materials
Table 2: Essential Research Reagents and Computational Tools for Microbiome Analysis
| Item Category | Specific Tool/Reagent | Function in Analysis Workflow |
|---|---|---|
| Bioinformatics Pipelines | DADA2, QIIME2, MOTHUR, LotuS2 | Core analysis platforms for processing raw sequencing data |
| Taxonomic Databases | Ribosomal Database Project, Greengenes, SILVA | Reference databases for taxonomic assignment |
| Quality Control Tools | FastQC, Trimmomatic, Cutadapt | Pre-processing and quality assessment of raw sequences |
| Primer Sequences | V1-V2, V3-V4, V4 region-specific primers | Target amplification of specific 16S rRNA gene regions |
| Reference Data | Mock communities with known composition | Validation and benchmarking of pipeline performance |
Critical Parameter Optimization Strategies
Truncation Length Selection and Quality Control
Truncation length parameters directly impact read quality, merging efficiency, and downstream results. The DADA2 pipeline tutorial recommends visualizing quality profiles to guide truncation decisions, suggesting "trimming the last few nucleotides to avoid less well-controlled errors" [3]. For 2x250 Illumina MiSeq data of the V4 region, their workflow truncates forward reads at position 240 and reverse reads at position 160 based on observed quality score distributions [3].
A critical consideration is maintaining sufficient overlap after truncation—your reads must still overlap after truncation in order to merge them later [3]. For less-overlapping primer sets like V1-V2 or V3-V4, the truncLen must be large enough to maintain "20 + biological.length.variation nucleotides of overlap" between forward and reverse reads [3]. Empirical data from user experiences shows that insufficient overlap (e.g., truncating both reads at 210 in a 2x250 setup) results in minimal merging, while properly optimized overlap (e.g., 220 forward/210 reverse) maintains merging efficiency [54].
The following workflow diagram illustrates the parameter optimization process for truncation length selection:
Primer Removal and Error Rate Optimization
Primer removal prior to denoising significantly impacts chimera detection and read retention rates. User experiments demonstrate that removing primers using Cutadapt before running DADA2 denoising increased non-chimeric reads from 10-15% to 40-45% in the same samples [55]. However, improper parameter settings after primer removal can drastically reduce read retention, with one user reporting only 0.03-0.05% of reads retained as non-chimeric when using inappropriate truncation parameters based solely on expected amplicon size [55].
Error rate parameters (maxEE) serve as a critical filter that incorporates both read length and quality. The DADA2 tutorial recommends maxEE=2 as a starting point, noting that it "sets the maximum number of 'expected errors' allowed in a read, which is a better filter than simply averaging quality scores" [3]. They suggest tightening maxEE to speed up downstream computation or relaxing it if too few reads pass the filter [3]. User experiences with problematic error rate plots despite Q30 filtering highlight that quality scores alone don't capture all error aspects, necessitating careful maxEE tuning [56].
Chimera Detection and Pooling Methods
Chimera detection methodology significantly impacts variant calling results, with pooling strategy being a particularly influential parameter. User experiments reveal dramatic differences in chimera detection based on dataset structure and pooling method—in one case, chimeras were detected and filtered out in a 120-sample dataset but not detected at all in a 300-sample dataset or a combined 420-sample dataset using the same parameters [57].
The DADA2 pipeline offers multiple chimera detection approaches, including pooled, independent, and consensus methods. Evidence suggests that larger sample sizes may require parameter adjustments for optimal chimera detection, though the specific mechanisms remain unclear [57]. Additionally, studies show that primer removal prior to denoising substantially improves chimera detection, likely because residual primers interfere with accurate sequence variant identification [55].
Table 3: Parameter Optimization Guidelines Across Major Pipelines
| Parameter Category | DADA2 | QIIME2 | MOTHUR | Performance Impact |
|---|---|---|---|---|
| Truncation Length | Based on quality plots; Maintain ≥20nt overlap | Similar to DADA2; Often integrated via plugins | Custom algorithms based on quality windows | Directly affects merge rates and ASV quality |
| Error Rates (maxEE) | Recommended starting value of 2; Adjust based on retention | Implemented through quality filtering plugins | Quality-based trimming with different thresholds | Balances read retention versus error inclusion |
| Chimera Detection | Pooled, consensus, or independent methods | Similar options via DADA2 plugin | UCHIME implementation with custom thresholds | Dramatically affects final ASV/OTU counts |
| Primer Handling | External removal with Cutadapt recommended | Integrated Cutadapt functionality | Internal primer removal capabilities | Critical for chimera reduction and accuracy |
Comparative Performance Across Pipelines
Reproducibility and Accuracy Benchmarks
The 2025 comparative study examining gastric mucosal microbiome composition found that all three major pipelines (DADA2, MOTHUR, and QIIME2) produced reproducible results for key biological findings, including Helicobacter pylori status, microbial diversity, and relative bacterial abundance [1]. This reproducibility across independent research groups underscores the robustness of modern microbiome analysis when proper parameters are employed.
Benchmarking studies evaluating the LotuS2 pipeline (which incorporates DADA2, UNOISE3, VSEARCH, and other clustering algorithms) demonstrated superior performance in several metrics compared to other pipelines [8]. LotuS2 recovered a higher fraction of correctly identified taxa and a higher fraction of reads assigned to true taxa (48% and 57% at species level; 83% and 98% at genus level, respectively) [8]. Additionally, LotuS2 showed the highest precision and F-score at the ASV/OTU level, along with the highest fraction of correctly reported 16S sequences [8].
Processing Efficiency and Practical Implementation
Processing speed and computational efficiency represent practical considerations for researchers selecting and tuning analysis pipelines. Benchmarking results indicate that LotuS2 was on average 29 times faster compared to other pipelines while simultaneously better reproducing the alpha- and beta-diversity of technical replicate samples [8]. This demonstrates that careful pipeline optimization can improve both efficiency and accuracy.
The following diagram illustrates the complex relationships between parameter choices and their effects on downstream analysis results:
Based on comparative studies and user experiences, several best practices emerge for optimizing truncation length, error rates, and chimera removal parameters:
Implement primer removal before denoising using tools like Cutadapt, as this consistently improves chimera detection rates and increases non-chimeric read recovery [55].
Set truncation lengths based on quality profiles rather than fixed values, ensuring sufficient overlap remains (at least 20nt + biological variation) for successful read merging [3].
Utilize expected errors (maxEE) for filtering rather than simple quality averaging, beginning with maxEE=2 and adjusting based on read retention rates [3].
Select chimera detection methods based on dataset structure, considering that larger datasets may require different pooling approaches than smaller ones [57].
Document all parameters thoroughly to ensure reproducibility, as different pipelines can produce comparable results when properly optimized and documented [1].
The 2025 comparative study concluded that "different microbiome analysis approaches from independent expert groups generate comparable results when applied to the same data set" [1]. This finding is crucial for interpreting respective studies and underscores the broader applicability of microbiome analysis in clinical research, provided that robust pipelines are utilized and thoroughly documented to ensure reproducibility. As the field continues to mature, systematic parameter optimization and transparent reporting will remain essential for generating reliable, translatable microbiome research findings.
Mitigating Platform-Specific Biases in Illumina and Ion Torrent Data
In the field of microbiome bioinformatics, the reproducibility of research findings across different sequencing platforms and bioinformatics pipelines is paramount. The choice between major next-generation sequencing (NGS) platforms, primarily Illumina and Ion Torrent, introduces technical variations that can significantly impact downstream biological interpretation if not properly addressed [58]. These platform-specific biases represent a substantial challenge for consortium studies, multi-center trials, and the longitudinal integration of microbial community data [58] [59]. Within the broader context of evaluating bioinformatics pipeline reproducibility (encompassing DADA2, MOTHUR, and QIIME2), understanding and mitigating these platform-induced technical artifacts is a fundamental prerequisite for ensuring robust, comparable, and reliable microbiome research [1]. This guide provides an objective comparison of Illumina and Ion Torrent performance, supported by experimental data, and outlines methodologies to correct for platform-specific biases.
The core technological differences between Illumina and Ion Torrent sequencing methodologies are the primary source of platform-specific biases. Understanding these fundamental mechanisms is crucial for interpreting the data they generate.
- Illumina Sequencing: This platform employs a fluorescence-based sequencing-by-synthesis approach. DNA fragments are amplified on a flow cell via bridge PCR, forming clusters. The sequencing process uses fluorescently-labeled, reversible terminator nucleotides. Each cycle incorporates a single base, which is identified by its fluorescent signal before the terminator is cleaved to allow the next incorporation [60]. This process allows for paired-end sequencing, where both ends of a DNA fragment are sequenced, providing superior alignment capability [60] [61].
- Ion Torrent Sequencing: This platform utilizes semiconductor technology to detect nucleotides. It measures the minute pH change (release of a hydrogen ion) that occurs when a nucleotide is incorporated into a growing DNA strand [60]. The DNA is amplified on beads via emulsion PCR before being deposited into wells on a semiconductor chip. A key limitation is its difficulty in accurately counting the number of identical bases in a homopolymer (e.g., "AAAA"), which can lead to insertion/deletion (indel) errors [60] [62]. Furthermore, this technology typically produces only single-end reads [60].
The diagram below illustrates the core processes and highlights the key differences that lead to technical bias.
Performance Comparison and Experimental Data
The fundamental technological differences manifest as distinct performance characteristics, which have been quantified in various studies focusing on microbiome and other genomic applications.
Table 1: Platform Characteristics and Performance Overview
| Parameter | Illumina | Ion Torrent | Impact on Microbiome Data |
|---|---|---|---|
| Sequencing Chemistry | Fluorescent reversible terminators [60] | Semiconductor (pH change) [60] | Ion Torrent prone to homopolymer errors [62] |
| Read Output Structure | Uniform length, Paired-end available [60] [61] | Variable length, Single-end only [60] [61] | Illumina paired-end aids in assembly and reduces misclassification [62] |
| Raw Error Rate | ~0.1-0.5% (Very low) [60] | ~1% (Higher, homopolymer indels) [60] | Higher error rate can affect OTU/Taxonomy calling accuracy [62] |
| Typical Applications | WGS, RNA-Seq, Metagenomics [63] | Targeted panels, Amplicon sequencing [60] [63] | Both used for 16S rRNA amplicon sequencing [62] [64] |
Comparative Data from 16S rRNA Amplicon Sequencing
16S rRNA gene amplicon sequencing is a cornerstone of microbiome research. Direct comparisons between platforms reveal both concordance and specific biases.
- Concordance in Community Profiles: A study comparing cervical microbiota using Illumina MiSeq (V3-V4) and Ion Torrent PGM (V4) found that overall community profiles were highly correlated (r=0.89 for genus-level abundance) and functional predictions were nearly identical (r=1.00) [64]. This demonstrates that for broad community-level analyses, both platforms can yield similar biological conclusions.
- Taxon-Specific Abundance Biases: Despite overall correlation, the same study found significant relative abundance biases for specific genera. Gardnerella showed higher relative abundance with Ion Torrent, while Clostridium was higher with Illumina [64]. These taxon-specific biases could severely skew results in studies focusing on such organisms.
- Error Profile and Read Truncation: A mock community study highlighted that Ion Torrent data has a pattern of premature sequence truncation and higher error rates, which introduced organism-specific biases. These artifacts could be minimized but not eliminated by optimized sequencing flows and bidirectional amplicon sequencing [62].
Table 2: Quantitative Comparison from a 16S rRNA Amplicon Sequencing Study [64]
| Metric | Illumina MiSeq (V3/V4) | Ion Torrent PGM (V4) | Notes |
|---|---|---|---|
| Post-processed Reads | 2.4x more than Ion Torrent | Baseline | Higher sequencing depth per run |
| Taxonomy Assignment (Genus) | 95.9% | 92.2% | More unclassified reads in Ion Torrent data |
| Correlation of Genus Abundance | Reference | r = 0.89 (p<0.0001) | High overall correlation |
| Gardnerella Abundance | Lower | Higher | Platform-specific bias |
| Clostridium Abundance | Higher | Lower | Platform-specific bias |
Comparative Data from Whole-Genome and Gene Expression Analysis
Beyond amplicon sequencing, platform differences impact whole-genome and transcriptomic analyses, which are crucial for functional microbiome and pathogen characterization.
- Whole-Genome Sequencing and cgMLST: A recent 2025 study on Listeria monocytogenes surveillance found a critical incompatibility between platforms for core genome MLST (cgMLST). The average allele discrepancy was 14.5, far exceeding the commonly used cluster threshold of 7 alleles [59]. This means isolates sequenced on different platforms might not be clustered together during an outbreak investigation, with significant public health implications. While frameshift filtering could reduce the discrepancy, it came at the cost of discriminatory power [59].
- Differential Gene Expression (DGE): A study on the mouse hepatic inflammatory response found that while Illumina and Ion Torrent showed strong correlation in gene-level read counts (Spearman correlation ~0.94-0.97), the concordance in identifying individual differentially expressed genes was only moderate [61]. Reassuringly, the biological pathways identified as being significantly affected by the treatment were nearly identical between platforms, suggesting that higher-order biological conclusions can be robust despite technical differences [61].
Experimental Protocols for Platform Comparison
To ensure the reproducibility of findings like those cited above, detailed and standardized experimental protocols are essential. The following outlines a typical methodology for a cross-platform 16S rRNA amplicon sequencing study.
Sample Preparation and Library Construction
- Sample Collection and DNA Extraction: Use a well-defined set of samples, such as a mock microbial community (e.g., from BEI Resources) with known composition and/or a set of biological specimens (e.g., human, environmental). Extract DNA from all samples using a single, standardized kit and protocol to minimize pre-sequencing batch effects [62] [64].
- PCR Amplification: Amplify the target 16S rRNA gene region (e.g., V1-V2, V3-V4, or V4) from the same DNA aliquots. Use platform-specific primers that incorporate the respective sequencing adapters and sample barcodes (e.g., 8-bp for Illumina, 10-12-bp Ion Xpress for Ion Torrent) [62] [64].
- Library Purification and Quantification: Purify all PCR products using a standardized method like Agencourt AMPure beads. Precisely quantify the final libraries using a fluorometric method (e.g., Qubit dsDNA HS Assay) to ensure equal loading [62].
Platform-Specific Sequencing
- Illumina Sequencing: Load the library onto a MiSeq or similar system. Use a 500-cycle v2 reagent kit for 2x250 bp paired-end sequencing. Include a PhiX control (e.g., 5-10%) to improve base calling for diverse amplicon libraries [62].
- Ion Torrent Sequencing: Proceed to templating and enrichment using the OneTouch 2/ES systems. Sequence the library on an Ion PGM or S5 system using a 400-bp sequencing kit. Consider using an alternative flow order (e.g., TGCTCAGAGTACATCACTGCGATCTCGAGATG) for more aggressive phase correction, which can improve performance on amplicons with biased base composition [62].
Bioinformatic Processing and Analysis
- Data Processing and Quality Control: Process raw data through a standardized pipeline like AQUAMIS [59]. This includes adapter trimming, quality filtering, and read assembly. For Ion Torrent data, this step is critical for identifying and mitigating homopolymer-related errors.
- Microbiome Analysis with Multiple Pipelines: Analyze the high-quality sequences from both platforms using the relevant bioinformatics packages (e.g., DADA2, MOTHUR, QIIME2) independently [1]. Use the same taxonomic database (e.g., SILVA) for all analyses to ensure comparability.
- Comparative Statistics: Calculate alpha and beta diversity metrics. Use correlation analyses (e.g., Pearson's) to compare relative abundances of taxa across platforms [64]. Employ differential abundance analysis (e.g., LEfSe) to identify taxa with significant abundance biases between platforms [64].
The workflow for this comparative experiment is summarized below.
The Scientist's Toolkit: Essential Reagents and Materials
For researchers designing a robust platform comparison study, the following table details key reagents and materials, as derived from the experimental protocols in the search results.
Table 3: Key Research Reagent Solutions for Platform Comparison Studies
| Reagent / Material | Function / Purpose | Example from Literature |
|---|---|---|
| Mock Microbial Community | A defined mix of genomic DNA from known organisms; serves as a gold standard for assessing accuracy, error rates, and bias. | Microbial Mock Community B (BEI Resources, HM-782D) [62] |
| Standardized DNA Extraction Kit | To isolate high-quality microbial DNA from all samples uniformly, eliminating a major source of pre-analytical variation. | High Pure PCR Template Preparation Kit (Roche) [62] |
| Platform-Specific 16S rRNA Primers | Primer sets with platform-specific adapter sequences for amplifying the target hypervariable region(s). | Derivatives of 8F/557R with Illumina or Ion Torrent adapters [62] |
| Library Preparation Kit | Kits containing enzymes and buffers for preparing sequencing-ready libraries. | Illumina Nextera XT / DNA Prep Kit; Ion Plus Fragment Library Kit [59] |
| Library Quantification Kit | Fluorometric assay for precise quantification of DNA libraries to ensure balanced sequencing representation. | Qubit dsDNA BR/HS Assay Kit [59] [62] |
| Post-sequencing Bioinformatics Pipeline | Software for standardized QC, trimming, assembly, and analysis, enabling fair cross-platform comparison. | AQUAMIS pipeline [59]; QIIME, UPARSE [64] |
Illumina and Ion Torrent sequencing platforms both produce data capable of revealing robust biological patterns in microbiome studies, particularly at the pathway or community level [1] [61]. However, platform-specific biases are real and significant, manifesting as homopolymer errors, taxon-specific abundance distortions, and critical discrepancies in high-resolution applications like cgMLST [59] [62] [64]. Mitigating these biases requires a multi-faceted approach: employing a rigorous experimental design that includes mock communities and standardized protocols, applying post-sequencing corrective filters (e.g., for frameshifts), and selecting bioinformatics pipelines that are aware of these platform-specific artifacts [59] [62]. For the field to advance in reproducibility, especially in the context of comparing results from DADA2, MOTHUR, and QIIME2, researchers must proactively account for the underlying sequencing technology as a fundamental source of technical variation [58] [1]. Transparent reporting of the platform and all correction steps used is no longer a best practice but a necessity for reproducible microbiome science.
Best Practices for Quality Control, Read Merging, and Denoising
High-throughput 16S rRNA gene amplicon sequencing has become a fundamental tool for characterizing microbial communities across diverse environments, from human health to ecosystems. However, the interpretation of these studies is significantly biased by the selected bioinformatics pipeline, impacting the reliability and reproducibility of research findings [65]. The critical steps of quality control, read merging, and denoising involve multiple methodological choices that directly influence downstream taxonomic profiles and ecological conclusions. Independent comparisons reveal that analysis tools differ dramatically in their performance regarding sequence recovery, taxonomic assignment accuracy, and diversity estimates [65]. This guide objectively compares the performance of established bioinformatics pipelines—DADA2, QIIME2, and MOTHUR—within the broader context of standardizing microbiome research for reproducible results.
Pipeline Performance Comparison
Accuracy and Specificity Benchmarks
Independent evaluations using mock communities with known compositions provide critical performance metrics for pipeline selection.
Table 1: Comparative Performance of Major Analysis Pipelines Based on Mock Community Studies
| Pipeline | Core Algorithm Type | Sequence Recovery & False Positives | Taxonomic Assignment (F-score) | Diversity Estimate Accuracy | Key Strengths |
|---|---|---|---|---|---|
| QIIME2 | ASV (DADA2, Deblur) | >10x fewer false positives than other tools [65] | >22% better F-score than other tools [65] | >5% better assessment than other tools [65] | Highest overall accuracy; reflects in-situ community most accurately [65] |
| MOTHUR | OTU (97% clustering) | Not specified in results | Lower than QIIME2 [65] | Lower than QIIME2 [65] | A well-established, comprehensive toolkit |
| QIIME1 | OTU (97% clustering) | Inflated numbers of OTUs with standard parameters [65] | Lower than QIIME2 [65] | Lower than QIIME2 [65] | Pioneering platform, now superseded by QIIME2 |
Computational Efficiency and Resource Usage
Benchmarking studies also evaluate the practical aspects of pipeline performance, including runtime and memory requirements, which are crucial for processing large datasets.
Table 2: Computational Resource Usage in Amplicon Analysis Pipelines
| Pipeline | Workflow Management | Typical RAM Usage | Processing Speed | Denoising Strategy |
|---|---|---|---|---|
| zAMP (DADA2) | Snakemake | ~8 GB [66] | Faster than Ampliseq [66] | Per-sample, which likely contributes to speed [66] |
| nf-core/Ampliseq | Nextflow | ~10 GB [66] | Slower than zAMP [66] | Per-run [66] |
Experimental Protocols for Benchmarking
To ensure the reliability and reproducibility of pipeline comparisons, studies employ rigorous experimental designs based on mock communities and standardized protocols.
Mock Community Design and Sequencing
Benchmarking studies rely on mock microbial communities with known compositions to validate bioinformatic pipelines:
- Community Types: Mock communities should mimic real environmental samples and include closely related species to test resolution limits. Examples include the ATCC MSA-1000 (environmental mimic), in-house communities with congeneric species (MCAP, MCGD), and logarithmically distributed communities like ZymoBIOMICS to assess sensitivity and limits of detection [67].
- Sequencing Platforms: Evaluations should encompass both short-read (Illumina) and long-read (PacBio, Oxford Nanopore Technologies) platforms to assess technology-specific biases [67].
- Amplicon Targets: Studies compare different hypervariable regions (e.g., V3-V4) for short-read sequencing, full-length 16S rRNA gene (~1500 bp), and the more powerful 16S-ITS-23S rRNA operon (RRN, ~4500 bp) for superior species-level resolution [67].
Bioinformatic Analysis and Evaluation Metrics
The processing and evaluation phase is critical for objective comparison:
- Processing Pipelines: Raw sequencing data is processed through multiple parallel pipelines (e.g., MOTHUR, QIIME1, QIIME2 with DADA2 or Deblur) using their standard protocols [65].
- Classification Methods: For long-read RRN sequencing, direct alignment with Minimap2 consistently provides more accurate species-level classification compared to OTU clustering followed by BLAST classification [67].
- Performance Metrics:
- Taxonomic Accuracy: F-score, precision, and recall calculated by comparing pipeline outputs to the known mock composition [65].
- Community Representation: Beta-diversity analysis (e.g., PCoA with Bray-Curtis dissimilarity and PERMANOVA) quantifies how well each pipeline reproduces the expected community structure [67] [65].
- False Positive Rates: Evaluated using database exclusion tests, where classifiers are run against databases deliberately missing certain taxa to simulate real-world conditions [68].
Visualization of Pipeline Workflows and Performance
The following diagram illustrates the typical workflows of OTU-clustering and ASV-denoising approaches, highlighting key steps where methodological choices impact results.
Table 3: Key Research Reagent Solutions for Microbiome Pipeline Evaluation
| Resource Category | Specific Examples | Function in Pipeline Evaluation |
|---|---|---|
| Reference Databases | GreenGenes, SILVA, RDP, GROND, MIrROR [67] [68] | Provide reference sequences for taxonomic classification; database choice significantly impacts assignment accuracy [67]. |
| Mock Communities | ATCC MSA-1000, ZymoBIOMICS, in-house developed communities [67] | Serve as ground truth for validating pipeline accuracy and quantifying false positive/negative rates [67] [65]. |
| Standardized Protocols | EcoFAB 2.0 devices, SynCom inoculation methods [7] | Enable reproducible plant-microbiome studies across laboratories by controlling biotic and abiotic factors [7]. |
| Containerization Tools | Docker, Singularity, Conda environments [66] | Ensure computational reproducibility by managing software dependencies and versions [66]. |
| Workflow Managers | Snakemake, Nextflow [9] [66] | Automate complex analysis pipelines, enabling parallel processing and enhancing reproducibility [9] [66]. |
| Classification Algorithms | Minimap2, MMSeqs2, BLAST, Kraken2, Naive Bayes classifiers [67] [68] | Perform taxonomic assignment; algorithm choice significantly impacts species-level resolution and false positive rates [67] [68]. |
| Curated Strain Collections | DSMZ bacterial isolates, synthetic communities (SynComs) [7] | Provide well-characterized microbial strains for controlled experimentation and community assembly studies [7]. |
In the field of microbiome research, the ability to convert data between different bioinformatics pipelines is not merely a technical convenience—it is a fundamental requirement for robust scientific reproducibility and collaborative analysis. The coexistence of multiple powerful analysis platforms, primarily QIIME 2, MOTHUR, and the broader ecosystem built around the BIOM (Biological Observation Matrix) format, creates both opportunities and challenges for researchers [69] [70]. While each platform offers unique strengths and analytical perspectives, their interoperability ensures that researchers are not permanently locked into a single analytical pathway and can leverage the best tools from different ecosystems.
This guide objectively examines the practical aspects of converting data between these platforms, grounded in empirical evidence from comparative studies. The reproducibility of microbiome findings across different analytical pipelines is a cornerstone of credible science, particularly as microbiome applications expand into clinical and pharmaceutical domains [1]. By providing clear protocols, comparative data, and troubleshooting guidance, this resource aims to empower researchers to navigate format conversions confidently, thereby enhancing the transparency, reproducibility, and collaborative potential of their microbiome research.
Comparative Performance: Quantitative Evidence from Cross-Platform Studies
Key Findings from Pipeline Comparison Studies
Independent studies have systematically evaluated the analytical outcomes of different microbiome pipelines, providing a evidence-based perspective on their consistency. A 2025 comparative study of gastric mucosal microbiome analysis, which involved five independent research groups applying DADA2, MOTHUR, and QIIME 2 to the same dataset, found that despite differences in implementation, these pipelines generated broadly comparable results for major biological findings [1]. Specifically, Helicobacter pylori status, microbial diversity, and relative abundance of major taxa were reproducible across all platforms, underscoring the reliability of core microbiome metrics despite analytical differences [1].
An earlier 2018 rumen microbiota study provided more nuanced insights, directly comparing MOTHUR and QIIME (the predecessor to QIIME 2) when analyzing the same 16S rRNA amplicon sequences from dairy cows [71]. This research revealed that while both tools showed a high degree of agreement in identifying the most abundant genera (RA > 1%), statistically significant differences emerged in the analysis of less abundant taxa (RA < 10%), particularly when using the GreenGenes database [71]. MOTHUR consistently clustered sequences into a larger number of OTUs and assigned a greater relative abundance to these less frequent microorganisms, resulting in richer observed communities and more favorable rarefaction curves [71].
Table 1: Comparative Performance of MOTHUR and QIIME (QIIME 1) from Rumen Microbiota Study
| Performance Metric | MOTHUR | QIIME | Statistical Significance | Database Used |
|---|---|---|---|---|
| Abundant genera (RA > 1%) | High agreement | High agreement | Not significant (P > 0.05) | SILVA & GreenGenes |
| Less abundant genera (RA < 10%) | Higher RA detected | Lower RA detected | Significant (P < 0.05) | GreenGenes |
| Number of OTUs clustered | Larger number | Smaller number | Significant (P < 0.001) | SILVA & GreenGenes |
| Taxonomic assignment rate | 67% unassigned (SD=2.5) | 61% unassigned (SD=2.7) | Significant (P < 0.001) | GreenGenes |
| Total genera identified | 29 | 24 | Not reported | GreenGenes |
The Database Effect on Interoperability Outcomes
The choice of reference database significantly influences the consistency of results between platforms. The rumen microbiota study found that using the SILVA database attenuated the differences between MOTHUR and QIIME, leading to more comparable richness, diversity, and relative abundance estimates for most common rumen microbes [71]. This suggests that database selection can be a critical factor in ensuring reproducible results when multiple analytical pipelines are employed in a study. The 2025 gastric microbiome study further confirmed that alignment to different taxonomic databases (Ribosomal Database Project, GreenGenes, and SILVA) had only a limited impact on taxonomic assignment and thus on global analytical outcomes, reinforcing the robustness of findings across platforms [1].
Technical Architectures and Philosophical Differences
Understanding the fundamental architectural differences between QIIME 2 and MOTHUR provides crucial context for interoperability challenges and solutions. MOTHUR is primarily implemented in C/C++, a compiled language that offers performance advantages for computationally intensive tasks, with the developers reporting their aligner runs 21.9-times faster than QIIME's Python-based aligner [69]. This approach creates a standalone, self-contained package with minimal external dependencies [69].
In contrast, QIIME 2 employs a plugin-based architecture written primarily in Python, functioning as a sophisticated framework that integrates specialized tools from the community [70]. This design offers great extensibility and modularity, allowing for rapid incorporation of new algorithms, but can create dependency challenges [69]. Since its redesign from QIIME 1, QIIME 2 has placed a strong emphasis on reproducibility and transparency through features like decentralized data-provenance tracking, which automatically records all analysis steps [70].
The BIOM format serves as a critical interoperability bridge between these ecosystems, providing a standardized framework for representing biological observation tables in a efficient, binary format that all major microbiome analysis platforms support [70]. Despite this standardization, version compatibility issues can still arise, as will be discussed in the troubleshooting section.
Experimental Protocols for Format Conversion
General Workflow for Cross-Platform Data Exchange
The following diagram illustrates the general workflow and logical relationships for converting data between QIIME 2, MOTHUR, and BIOM formats:
Converting from QIIME 2 to MOTHUR
Protocol for Feature Table and Taxonomic Data Conversion:
Export from QIIME 2: Begin by exporting the feature table from QIIME 2 format (.qza) to BIOM format (.biom) using the QIIME 2 command-line interface:
This will create a file named
feature-table.biomin the output directory [72].BIOM Version Compatibility Check: MOTHUR has historically supported BIOM format version 1.0, while QIIME 2 exports in newer versions (2.1 or higher) [73]. If encountering compatibility issues, convert the BIOM file to a TSV (tab-separated values) format, which serves as a universal intermediate:
This conversion may take varying amounts of time depending on file size, and patience is required as the command may not provide immediate feedback [72].
Import into MOTHUR: In MOTHUR, use the
biom.info()command with theformat=tsvparameter to import the converted file:Following this, the
make.shared()command can be used to create MOTHUR's shared file format for downstream analysis [74].Taxonomy Data Handling: For taxonomy data, QIIME 2 typically exports this as a separate TSV file, which can be directly formatted for MOTHUR compatibility. Community support forums indicate that converting taxonomy files from QIIME 2 to MOTHUR format is generally straightforward, though specific syntax may depend on the exact file structure [74].
Converting from MOTHUR to QIIME 2
Protocol for OTU Table and Phylogenetic Data:
Export from MOTHUR: From within MOTHUR, use the
make.biom()command to convert the current shared file and associated taxonomy data into a BIOM format file that can be imported into QIIME 2. Ensure you're using a recent version of MOTHUR (v1.41 or later) for better compatibility with current BIOM standards [73].Import into QIIME 2: Use QIIME 2's import tools to bring the MOTHUR-generated BIOM file into the QIIME 2 ecosystem. The specific import command will depend on the type of data being imported (feature table, taxonomy, etc.):
Troubleshooting HDF5 Format: If the standard BIOM import fails, you may need to convert the MOTHUR-generated BIOM file to HDF5 format, which QIIME 2 typically handles well:
This approach may resolve format compatibility issues between the ecosystems [73].
The Scientist's Toolkit: Essential Materials and Reagents
Table 2: Key Research Reagent Solutions for Microbiome Format Interoperability
| Tool/Resource | Function/Purpose | Usage Context |
|---|---|---|
| BIOM Format (v2.1+) | Standardized container for biological observation matrices; enables data exchange between platforms | Universal exchange format between QIIME 2, MOTHUR, and other bioinformatics tools |
| QIIME 2 Studio | Graphical user interface for QIIME 2; facilitates metadata validation and exploratory analysis | Alternative to command-line interface for less computationally experienced users |
| Keemei | Google Sheets plugin for validating QIIME 2 metadata files; checks formatting requirements before import | Metadata quality control in Google Sheets environment |
| BIOM Convert Utility | Command-line tool for converting between BIOM format and TSV/CSV formats | Troubleshooting format compatibility issues; creating human-readable data versions |
| Reference Databases (SILVA, GreenGenes) | Curated collections of aligned sequences for taxonomic classification; impacts consistency between tools | Taxonomic assignment in both QIIME 2 and MOTHUR; database choice affects interoperability |
| Conda Environments | Isolated software environments that manage package dependencies and versions | Preventing conflicts between QIIME 2, MOTHUR, and BIOM tool versions |
Troubleshooting Common Interoperability Challenges
BIOM Conversion and Version Compatibility
Problem: The biom convert command appears to hang without producing output or error messages [72].
Solution: This behavior may indicate that the process is running but taking longer than expected, particularly with large feature tables. Monitor system processes to confirm activity. If the process is genuinely stuck, it may indicate a version conflict between the BIOM file version and the biom converter utility. Ensure you're using the BIOM tools provided within the QIIME 2 environment rather than a system-wide installation, as version mismatches can cause silent failures [72].
Problem: Error messages indicating "does not appear to be a BIOM file!" during conversion attempts [74] [75].
Solution: This typically indicates a formatting issue with the input file. For TSV files, verify that the file uses proper tab separation (not spaces or other delimiters) and that all cells contain appropriate values (not mixed data types). The header row must be properly formatted, and comment lines should begin with # [75]. When exporting from MOTHUR, ensure you're using a current version that supports the latest BIOM standards [73].
Metadata Formatting Requirements
Problem: QIIME 2 metadata validation failures during import.
Solution: QIIME 2 has specific metadata formatting requirements that must be adhered to for successful data import [76]:
- The file must be in TSV (tab-separated values) format, typically with a
.tsvor.txtextension - The first column must be the identifier column with a header named
id,sampleid, or other accepted variants (case-insensitive) - Empty cells represent missing data; other placeholders like
NAare not automatically interpreted as missing - Leading and trailing whitespace is automatically ignored, which can sometimes cause unexpected matching behavior
- Use the Keemei plugin for Google Sheets to validate metadata files before importing them into QIIME 2 [76]
Taxonomic Database Consistency
Problem: Discrepancies in taxonomic assignments between platforms after conversion.
Solution: The 2018 rumen microbiota study demonstrated that using the SILVA database produced more consistent results between MOTHUR and QIIME than GreenGenes [71]. When comparing results across platforms or conducting meta-analyses, consistent use of the same reference database version is crucial. Document the database name and version used in all analyses to ensure future reproducibility.
Based on the empirical evidence and technical protocols presented herein, we recommend the following strategic approaches for ensuring interoperability in microbiome research:
Plan for Interoperability from Study Design: Anticipate the potential need for cross-platform analysis by implementing robust sample and feature identifiers that adhere to the recommendations of both platforms (≤36 characters, ASCII alphanumeric characters with periods or dashes only) [76].
Standardize on the SILVA Database for Comparative Studies: When research involves comparisons between QIIME 2 and MOTHUR analyses, the SILVA reference database produces more consistent taxonomic assignments, particularly for less abundant taxa [71].
Leverage BIOM as the Interoperability Bridge: The BIOM format remains the most effective intermediary for data exchange between platforms, though researchers should be prepared for version-specific conversion steps and validate data integrity after conversion.
Document Provenance Meticulously: While QIIME 2 automatically tracks data provenance, when moving data between platforms, manual documentation of conversion steps, software versions, and parameters becomes essential for reproducibility.
The demonstrated reproducibility of major biological findings across different bioinformatics pipelines [1] underscores the maturity of microbiome analysis platforms while highlighting the importance of the interoperability frameworks that connect them. As the field continues to evolve toward integrated multi-omics approaches, these foundational principles of data exchange and conversion will remain essential for advancing microbiome science and its applications in drug development and clinical practice.
Benchmarking Pipelines: A Rigorous Validation and Comparative Analysis
Microbiome analysis has become a crucial tool for basic and translational research, holding significant potential for translation into clinical practice. However, the field has been plagued by ongoing controversy regarding the comparability of different bioinformatic analysis platforms and a lack of recognized standards, potentially impacting the translational potential of research findings. This comprehensive comparison guide objectively evaluates the performance and reproducibility of three frequently used microbiome analysis bioinformatic packages—DADA2, MOTHUR, and QIIME2—when applied to the same gastric mucosal microbiome dataset. The evaluation is situated within the broader context of a growing research emphasis on microbiome bioinformatics pipeline reproducibility, addressing critical concerns within the scientific community about whether different analytical approaches generate consistent, reliable results that can be confidently applied in clinical and research settings. For researchers, scientists, and drug development professionals, understanding the reproducibility and limitations of these tools is paramount for advancing microbiome science toward clinical applications.
Table 1: Key Analytical Pipelines Compared
| Pipeline | Primary Approach | Key Strengths | Development Context |
|---|---|---|---|
| DADA2 | Divisive amplicon denoising algorithm | High-resolution amplicon variant inference | R package, often used via QIIME2 |
| MOTHUR | 16S rRNA analysis suite | Comprehensive, all-in-one workflow | Early open-source initiative |
| QIIME2 | Modular, extensible platform | User-friendly, standardized workflows | Successor to original QIIME |
Experimental Design & Methodologies
Source Dataset and Sample Characteristics
The comparative analysis was conducted using a well-defined gastric microbiome dataset derived from clinical samples. The source dataset encompassed 16S rRNA gene raw sequencing data (V1-V2 hypervariable regions) from gastric biopsy samples obtained from clinically well-characterized individuals. The cohort included gastric cancer (GC) patients (n = 40; with and without Helicobacter pylori infection) and controls (n = 39, with and without H. pylori infection). This experimental design allowed researchers to evaluate pipeline performance across different clinical states and microbial community structures, including the pronounced dominance of H. pylori in infected individuals. All pipelines were applied to the identical subset of fastQ files to enable direct comparison of their outputs without variability introduced by differing starting materials [1] [49].
Participating Research Groups and Analytical Approach
To eliminate bias from individual analytical approaches, the comparison was conducted across five independent research groups, each applying their expertise with the different bioinformatic packages. This multi-group design provided a robust assessment of whether different expert teams could generate comparable results using their preferred pipelines. Each group processed the same raw sequencing data through their chosen pipeline (DADA2, MOTHUR, or QIIME2) following standardized protocols while maintaining their specific implementation approaches. The reproducibility of key microbiome metrics—including H. pylori status detection, microbial diversity measures, and relative bacterial abundance—was assessed across all platforms despite differences in their underlying algorithms and processing steps [1].
Taxonomic Database Alignment Evaluation
An additional layer of comparison involved testing how alignment of filtered sequences to different taxonomic databases affected results. The study evaluated both older and newer taxonomic databases, including the Ribosomal Database Project (RDP), Greengenes, and SILVA. This assessment was crucial for determining whether database choice introduced significant variability in taxonomic assignment and consequently influenced overall analytical outcomes. The limited impact observed across database choices underscores the robustness of the core findings across different pipeline configurations [1] [49].
Diagram 1: Experimental workflow for the multi-pipeline reproducibility comparison. Five independent research groups analyzed the same gastric microbiome FASTQ files using three bioinformatic pipelines and three taxonomic databases to evaluate consistency across key analytical metrics.
Comparative Performance Results
Reproducibility of Key Microbiome Metrics
The cross-pipeline comparison demonstrated remarkably consistent results for fundamental microbiome analyses despite algorithmic differences between platforms. The table below summarizes the quantitative findings from the comparative assessment of the three pipelines across essential analytical outcomes [1] [49].
Table 2: Reproducibility of Core Microbiome Metrics Across Pipelines
| Analytical Metric | DADA2 | MOTHUR | QIIME2 | Cross-Platform Consistency |
|---|---|---|---|---|
| H. pylori Detection | Reproducible across all samples | Reproducible across all samples | Reproducible across all samples | High (100% agreement) |
| Alpha Diversity Measures | Consistent patterns | Consistent patterns | Consistent patterns | High (equivalent ecological interpretation) |
| Beta Diversity Patterns | Preserved sample grouping | Preserved sample grouping | Preserved sample grouping | High (equivalent separation of groups) |
| Relative Abundance (Major Taxa) | Comparable proportions | Comparable proportions | Comparable proportions | High (consistent dominant taxa) |
| Differential Abundance | Reproducible significant findings | Reproducible significant findings | Reproducible significant findings | Moderate-High (effect direction consistent) |
Impact of Taxonomic Database Selection
A critical secondary analysis examined how the choice of taxonomic reference database influenced results across the different pipelines. The alignment of filtered sequences to different databases (RDP, Greengenes, and SILVA) had only a limited impact on taxonomic assignment and global analytical outcomes. While minor variations in specific taxonomic classifications were observed at finer resolution levels, these differences did not substantially alter the overall biological interpretations or conclusions derived from any of the pipelines. This finding suggests that database choice, while important for specific taxonomic assignments, does not fundamentally compromise the comparability of results across different analytical platforms when consistent database versions are employed [1] [49].
Performance Differences and Technical Considerations
Although the core biological findings were reproducible across platforms, the study did detect differences in performance characteristics between the pipelines. These included variations in processing speed, computational resource requirements, and user interface experiences. QIIME2 was particularly noted for providing a standardized and validated open-source pipeline for comprehensive 16S rRNA gene profiling, with recent enhancements for multi-amplicon sequencing data analysis that improve taxonomic resolution compared to single-region approaches [77]. The modular architecture of QIIME2 also facilitates the integration of DADA2 as a denoising plugin, creating a hybrid approach that leverages the strengths of both tools. MOTHUR provided a comprehensive, all-in-one workflow solution, while DADA2 offered high-resolution amplicon sequence variant inference, representing a different analytical approach compared to the operational taxonomic unit methods historically associated with MOTHUR and earlier versions of QIIME [1].
The Scientist's Toolkit
Table 3: Essential Research Reagents and Computational Tools
| Item | Function/Application | Implementation Notes |
|---|---|---|
| 16S rRNA Gene Sequencing (V1-V2) | Microbial community profiling | Provides taxonomic characterization of bacterial communities |
| Gastric Biopsy Samples | Source of mucosal microbiome | Preserved immediately after collection to maintain integrity |
| DADA2 Pipeline | Divisive amplicon denoising | Infer amplicon sequence variants (ASVs) |
| MOTHUR Pipeline | 16S rRNA analysis suite | Follow standardized operating procedure |
| QIIME2 Platform | Modular microbiome analysis | Integrate DADA2 for denoising |
| Taxonomic Databases (RDP, Greengenes, SILVA) | Taxonomic classification | Limited impact on global outcomes |
| Mock Communities | Pipeline validation | Include in sequencing runs to assess accuracy |
Methodological Protocols
Standardized 16S rRNA Gene Sequencing Protocol
The experimental methodology began with standardized 16S rRNA gene sequencing of gastric biopsy samples. The V1-V2 hypervariable regions were amplified and sequenced using semiconductor-based sequencing technology. This region selection provided optimal taxonomic resolution for the gastric microbiome while maintaining technical reproducibility. For all samples, the same library preparation protocol was followed, including appropriate negative controls to detect potential contamination and positive controls (mock communities with known composition) to assess sequencing accuracy. This rigorous initial protocol ensured that any observed differences in downstream analysis could be attributed to the bioinformatic pipelines rather than pre-analytical variability [1] [77].
Pipeline-Specific Processing Parameters
Each bioinformatic pipeline was implemented with its recommended best practices while maintaining analytical consistency across platforms:
DADA2 Implementation: The denoising algorithm was applied to infer amplicon sequence variants (ASVs) without pre-clustering, maintaining high resolution for distinguishing closely related sequences. Parameters were optimized for the specific sequencing technology and read length characteristics of the V1-V2 dataset [1].
MOTHUR Implementation: The analysis followed the standardized MOTHUR SOP for 16S rRNA gene analysis, including pre-processing, alignment against the SILVA reference database, chimera removal, and distance-based clustering. The pipeline utilized the entire toolkit within the MOTHUR environment without external processing steps [1] [49].
QIIME2 Implementation: The analysis leveraged QIIME2's modular architecture, incorporating quality control, denoising (using DADA2 plugin), feature table construction, and taxonomic assignment. The platform's built-in visualization tools were used to generate exploratory data analysis outputs [1] [77].
Diagram 2: Core analytical steps in microbiome bioinformatics pipelines. While all pipelines share fundamental processing stages, they diverge in their specific approaches to sequence variant inference, with DADA2 emphasizing amplicon sequence variants (ASVs) and MOTHUR utilizing operational taxonomic unit (OTU) clustering, while QIIME2 provides a modular framework that can incorporate multiple approaches.
This comprehensive comparison demonstrates that different microbiome analysis approaches—specifically DADA2, MOTHUR, and QIIME2—generate comparable and reproducible results when applied to the same gastric mucosal microbiome dataset. The consistency observed across independent research groups and platforms underscores the robustness of current microbiome analysis methods for detecting clinically relevant signatures, including Helicobacter pylori status, microbial diversity patterns, and relative bacterial abundance. While performance differences exist between platforms, the core biological interpretations remain stable, supporting the broader applicability of microbiome analysis in clinical research.
For researchers and drug development professionals, these findings provide confidence that results obtained from different robust pipelines can be compared and synthesized across studies, accelerating the translation of microbiome research into clinical applications. The critical requirement is not uniform pipeline selection but rather the utilization of robust, well-documented analytical approaches with full transparency in methodological reporting. This reproducibility foundation establishes microbiome analysis as a reliable approach for both basic research and translational applications, provided that analytical workflows are thoroughly documented to ensure reproducibility and enable meaningful comparisons across the expanding landscape of microbiome science.
Assessing Sensitivity and Specificity with Mock Communities and Real Datasets
High-throughput 16S rRNA gene amplicon sequencing has become a foundational tool for investigating microbial communities in both research and clinical settings. The translation of raw sequencing data into biologically meaningful information requires specialized bioinformatic pipelines, with DADA2, MOTHUR, and QIIME2 representing three widely used frameworks. However, the field has faced ongoing challenges regarding the comparability and reproducibility of results generated by different analysis platforms, creating uncertainty about their translational potential [1]. The assessment of pipeline performance through mock microbial communities (artificial mixtures with known composition) and real datasets provides critical validation of their analytical capabilities. By systematically evaluating sensitivity and specificity, researchers can determine the accuracy with which these tools reflect true microbial composition, thereby ensuring confidence in research outcomes and their potential clinical applications.
The terms sensitivity and specificity have precise definitions in diagnostic testing. Sensitivity represents the true positive rate—the ability of a test to correctly identify those with a condition—while specificity represents the true negative rate—the ability to correctly identify those without the condition [78]. In microbiome analysis, sensitivity refers to a pipeline's ability to correctly detect microbial taxa that are truly present, whereas specificity indicates its ability to avoid detecting taxa that are not present [79]. These metrics are inversely related and must be balanced based on research objectives, as improvements in sensitivity often come at the expense of specificity, and vice versa [80] [81].
Experimental Protocols for Pipeline Validation
Benchmarking with Mock Communities
Mock communities, comprising known compositions of microbial strains, serve as essential reference standards for validating bioinformatic pipelines by providing a ground truth against which computational outputs can be compared [65]. The standard methodology involves creating precisely defined mixtures of DNA from cultured microorganisms with known concentrations, followed by sequencing and bioinformatic analysis using the pipelines under investigation.
A typical experimental protocol begins with the selection and preparation of a mock community, such as the Altered Schaedler Flora (ASF) used in benchmarking the MetaPro pipeline [82]. The community should represent a range of phylogenetic diversity and abundance distributions, including both even and uneven distributions to simulate different ecological scenarios. Researchers then subject the mock community samples to the same DNA extraction, library preparation, and sequencing protocols applied to real samples, typically targeting hypervariable regions of the 16S rRNA gene (e.g., V1-V2, V3-V4) [1].
The resulting sequencing data is processed through each pipeline using standardized parameters to enable fair comparisons. The analytical process generally includes quality filtering, denoising or clustering, chimera removal, and taxonomic assignment against reference databases. The output taxonomic profiles are then compared to the known composition of the mock community, with discrepancies revealing pipeline-specific biases and errors [79] [65]. This comparison allows for the calculation of sensitivity (proportion of actual community members correctly detected) and specificity (proportion of reported taxa that are actually present in the mock community).
Validation with Real Environmental and Clinical Datasets
While mock communities provide controlled benchmarks, real datasets from environmental or clinical samples offer complementary validation by testing pipeline performance on complex, naturally occurring microbial communities [65]. These datasets capture the full complexity of microbial ecosystems but lack complete ground truth, requiring alternative validation approaches.
The standard methodology employs multiple pipelines applied to identical sequencing data from real samples, with comparisons focused on consistency in detecting biologically meaningful patterns. For example, in a recent gastric mucosal microbiome study, five independent research groups applied DADA2, MOTHUR, and QIIME2 to the same fastQ files from gastric biopsy samples of gastric cancer patients and controls [1]. The researchers then assessed concordance across pipelines for key analytical outcomes including Helicobacter pylori detection, microbial diversity measures, and relative abundance of bacterial taxa.
Additional validation approaches include using complementary molecular methods such as quantitative PCR or fluorescence in situ hybridization to verify the presence and abundance of specific taxa identified computationally. For metatranscriptomic pipelines like MetaPro, validation may involve spiking in known quantities of synthetic RNA transcripts to assess quantification accuracy across the processing workflow [82].
Figure 1: Experimental Workflow for Pipeline Validation. This diagram illustrates the standardized approach for comparing bioinformatics pipelines using both mock communities and real datasets to assess sensitivity and specificity.
Comparative Performance of DADA2, MOTHUR, and QIIME2
Sensitivity and Specificity Metrics Across Studies
Table 1: Comparative Sensitivity and Specificity of Microbiome Analysis Pipelines
| Pipeline | Analysis Approach | Reported Sensitivity | Reported Specificity | Key Strengths | Notable Limitations |
|---|---|---|---|---|---|
| DADA2 | ASV-based (single-nucleotide resolution) | Highest sensitivity in multiple comparisons [79] | Reduced specificity compared to UNOISE3 and Deblur [79] | Superior detection of true positives; fine resolution | Potential for higher false positives; requires careful parameter optimization |
| QIIME2 | ASV-based (Deblur) or OTU-based | >22% better F-score than other tools; >10x fewer false positives [65] | High specificity with Deblur algorithm [79] | Balanced performance; user-friendly interface; extensive documentation | Performance varies with algorithm choice (Deblur vs. DADA2) |
| MOTHUR | OTU-based (97% similarity clustering) | Good sensitivity for abundant taxa [1] | Lower specificity than ASV-level pipelines [79] | Established methodology; reduced spurious OTUs | Clustering masks biological variation; inflated diversity measures |
| USEARCH-UNOISE3 | ASV-based (error correction) | Good sensitivity with maintained specificity [79] | Best balance between resolution and specificity [79] | Optimal balance for many applications; efficient computation | Not open source; licensing restrictions |
| QIIME-uclust | OTU-based (clustering) | Moderate sensitivity | Low specificity; produces spurious OTUs [79] | Legacy compatibility; familiar workflow | Inflated alpha-diversity; not recommended for new studies |
Table 2: Pipeline Performance in Reproducibility Studies
| Performance Metric | DADA2 | QIIME2 | MOTHUR | Study Context |
|---|---|---|---|---|
| Helicobacter pylori Detection | Reproducible across all platforms [1] | Reproducible across all platforms [1] | Reproducible across all platforms [1] | Gastric cancer microbiome (n=79) |
| Microbial Diversity Estimates | Comparable across platforms [1] | >5% better assessment than other tools [65] | Comparable across platforms [1] | Multiple mock communities |
| Taxonomic Assignment Accuracy | High resolution at subspecies level | >22% better F-score [65] | Good for genus-level assignment | Environmental samples |
| False Positive Rate | Moderate control | Best controlled with Deblur [79] | Moderate control | Mock community analysis |
| Inter-Group Reproducibility | High concordance across research groups [1] | High concordance across research groups [1] | High concordance across research groups [1] | Multi-center comparison |
Impact on Biological Interpretations
The choice of bioinformatic pipeline can dramatically influence the biological interpretations derived from microbiome data. Different pipelines may detect varying microbial community structures from the identical sequencing data, potentially leading to contradictory ecological conclusions or clinical associations [65].
In environmental microbiome studies, comparative analyses have revealed that different pipelines detect entirely different dominant taxa from the same samples. For example, in river water samples, the genus Sphaerotilus was detected only when using QIIME1 (at 8% abundance), and Agitococcus was detected with QIIME1 or QIIME2 (at 2-3% abundance), but both genera remained undetected when analyzed with MOTHUR or MEGAN [65]. Since these taxa potentially participate in important biogeochemical cycles such as nitrate and sulfate reduction, their detection or non-detection could substantially alter interpretations of ecosystem functioning.
In clinical contexts, reproducible detection of pathogens or diagnostically relevant taxa across pipelines is essential for translational applications. A multi-group comparison demonstrated that Helicobacter pylori status, microbial diversity, and relative bacterial abundance were reproducible across DADA2, MOTHUR, and QIIME2 when applied to gastric biopsy samples from gastric cancer patients and controls [1]. This consistency across pipelines for key clinical parameters underscores the robustness of microbiome analysis for clinical research when properly validated workflows are employed.
The transition from OTU-based to ASV-based approaches represents a significant methodological shift with implications for data interpretation. ASV methods (DADA2, QIIME2-Deblur, UNOISE3) offer single-nucleotide resolution and higher reproducibility compared to OTU-based methods (MOTHUR, QIIME-uclust) that cluster sequences at an arbitrary similarity threshold (typically 97%) [79]. While ASV methods generally provide higher specificity by reducing spurious OTUs, their increased sensitivity to low-abundance taxa may potentially detect contaminants that would be clustered out in OTU-based approaches.
Table 3: Essential Research Reagents and Resources for Pipeline Validation
| Resource Category | Specific Examples | Application in Validation | Critical Functions |
|---|---|---|---|
| Reference Mock Communities | Altered Schaedler Flora (ASF); BEI Mock Communities [82] | Ground truth for sensitivity/specificity calculations | Provides known composition for benchmarking |
| Taxonomic Reference Databases | SILVA, Greengenes, Ribosomal Database Project [1] | Taxonomic assignment consistency testing | Alignment references for sequence classification |
| Curated Environmental Samples | Terrestrial, freshwater, human-associated biomes [65] | Real-world performance assessment | Tests pipeline performance on complex communities |
| High-Performance Computing Resources | Amazon EC2 instances; Linux computational servers [83] | Pipeline execution and comparison | Enables analysis of large datasets (>100 GB) |
| Containerization Platforms | Docker, Singularity [82] | Reproducible computational environments | Ensures consistent software versions and dependencies |
| Data Storage Solutions | Amazon S3 buckets [83] | Raw sequence and result storage | Centralized data management for collaborative teams |
The comprehensive comparison of DADA2, MOTHUR, and QIIME2 reveals that while all three pipelines can generate broadly comparable results for core microbiome parameters, they differ significantly in their sensitivity, specificity, and analytical resolution. The selection of an appropriate pipeline should be guided by specific research objectives, sample types, and analytical priorities.
For applications requiring maximum sensitivity and fine-scale resolution, DADA2 offers superior detection of true positives, though potentially at the expense of slightly reduced specificity [79]. For studies prioritizing balanced performance with maintained specificity, QIIME2 (particularly with the Deblur algorithm) provides an optimal combination of sensitivity and false positive control, along with user-friendly implementation and extensive documentation [65]. For researchers requiring established, cluster-based methodologies, MOTHUR remains a robust option, though it may lack the resolution of ASV-based approaches [1].
Crucially, recent multi-center comparisons demonstrate that when properly validated and documented, different microbiome analysis approaches can generate comparable results for key parameters including pathogen status, diversity measures, and relative abundance of major taxa [1]. This reproducibility across independent research groups underscores the maturity of microbiome analysis for basic and translational research, provided that robust, well-documented pipelines are employed. As the field continues to evolve, validation against mock communities and consensus-building across multiple analysis approaches will remain essential for ensuring the reliability and clinical applicability of microbiome research findings.
In microbiome research, the choice of bioinformatics pipeline is a critical determinant of the resulting ecological diversity estimates. Within the broader thesis of pipeline reproducibility, this guide objectively compares how DADA2, MOTHUR, and QIIME2 impact the calculation of alpha and beta diversity metrics. These metrics are fundamental for understanding microbial community structure and function, yet their estimation varies significantly based on the processing methods employed [2]. Evidence indicates that while overall ecological patterns often remain consistent, the absolute values of diversity metrics and the detection of rare taxa are highly sensitive to the computational techniques used, potentially affecting biological interpretations in research and drug development [84] [2].
Key Bioinformatics Pipelines at a Glance
The table below summarizes the core characteristics and methodological approaches of the three pipelines compared in this guide.
Table 1: Overview of Core Bioinformatics Pipelines
| Pipeline | Primary Method | Output Unit | Typical Singleton Handling | Key Considerations |
|---|---|---|---|---|
| DADA2 | Denoising | Amplicon Sequence Variants (ASVs) | Discarded by default in sample-wise mode; can be retained in pooled mode [84]. | Highly sensitive to parameter settings (e.g., pool option) which greatly affects richness [84]. |
| QIIME2 | Flexible Framework (can use DADA2, Deblur, etc.) | ASVs or OTUs | Depends on the plugin used (e.g., DADA2 discards by default) [84]. | An integrated environment; results can vary based on the chosen plugin and workflow [2] [85]. |
| MOTHUR | Clustering | Operational Taxonomic Units (OTUs) | More conservative confidence threshold; often retains rare sequences before rarefaction [86]. | Uses a more conservative classification threshold (e.g., 80%) compared to others, affecting taxonomy [86]. |
Impact on Alpha Diversity Metrics
Alpha diversity measures the species diversity within a single sample, incorporating richness (number of species), evenness (distribution of abundances), and sometimes phylogenetic relatedness [87] [88] [85].
Experimental Data and Comparative Findings
Different pipelines yield systematically different estimates of alpha diversity, particularly for richness.
Table 2: Impact of Bioinformatics Pipelines on Alpha Diversity Metrics
| Experimental Finding | Supporting Data | Implication for Researchers |
|---|---|---|
DADA2's pool parameter significantly influences richness. |
DADA2 without pooling (pool=FALSE) resulted in "much smaller" observed ASV richness compared to classic 97% OTU clustering. In contrast, DADA2 with pooling (pool=TRUE) produced richness higher than the OTU method and very similar to zOTU pipelines [84]. |
The choice between pooled and sample-wise processing in DADA2 is a major driver of observed richness, especially for rare taxa. |
| Pipeline choice affects relative abundance estimates. | A 2020 comparative study found that while taxa assignments were consistent across QIIME2, Bioconductor, UPARSE, and MOTHUR, the relative abundances of phyla and major genera (e.g., Bacteroides) showed statistically significant differences (p < 0.05) [2]. | Studies using different pipelines for relative abundance analysis may not be directly comparable without harmonization. |
| Overall alpha diversity patterns can remain stable. | Despite differences in absolute values, the overall patterns and rankings of samples by alpha diversity are often conserved across pipelines, allowing for robust within-study comparisons [84]. | The biological conclusion about which group is more diverse may be reliable, even if the exact numerical values are not. |
Methodological Protocols for Alpha Diversity Comparison
A standardized protocol is essential for a fair comparison of alpha diversity across pipelines.
- Sequence Processing: Process the same raw FASTQ dataset through each pipeline (DADA2, MOTHUR, QIIME2) using their standard workflows. For DADA2, this includes both the
pool=TRUEandpool=FALSEmodes [84]. - Rarefaction: To correct for differing sequencing depths, rarefy all feature tables to an even sampling depth. The depth should be chosen based on alpha rarefaction curves to maximize data retention while ensuring diversity estimates have stabilized [85].
- Metric Calculation: Calculate a suite of alpha diversity metrics from the rarefied tables for each pipeline. Essential metrics include:
- Observed Features (Richness): The simplest count of unique ASVs/OTUs [88] [85].
- Shannon Index: Estimates richness and evenness, giving weight to both common and rare species [87] [88].
- Faith's Phylogenetic Diversity (PD): Incorporates phylogenetic distances between organisms, where a community with distantly related species is considered more diverse [85].
- Statistical Comparison: Use non-parametric tests like the Kruskal-Wallis test to determine if alpha diversity differs significantly between groups of samples. For longitudinal data, employ methods like linear mixed-effects models that account for repeated measures [85].
The following workflow diagram summarizes the key experimental steps for comparing alpha diversity across pipelines:
Impact on Beta Diversity Metrics
Beta diversity quantifies the differences in microbial community composition between samples, often visualized using ordination techniques and tested with statistical methods like PERMANOVA [89] [90].
Experimental Data and Comparative Findings
The choice of distance metric has a greater impact on beta diversity results than the choice of pipeline, though pipeline-induced differences in underlying data remain important.
Table 3: Impact of Bioinformatics Pipelines on Beta Diversity Metrics
| Experimental Finding | Supporting Data | Implication for Researchers |
|---|---|---|
| Overall beta diversity patterns are robust. | Studies report that despite differences in alpha diversity, the overall patterns of beta diversity (e.g., sample clustering and separation in PCoA plots) are often consistent across DADA2, zOTU, and OTU pipelines [84]. | The high-level story of which sample groups are similar or different is generally reliable across pipelines. |
| Distance metric choice is critical. | Different metrics capture different aspects of community difference. Bray-Curtis incorporates abundance, Jaccard is presence-absence, and UniFrac incorporates phylogenetic relationships [90] [91]. | The conclusion about community similarity can depend on the chosen metric. Reporting multiple metrics is advised. |
| Pipeline affects downstream statistical results. | While patterns may be consistent, the specific p-values and R² values from statistical tests like PERMANOVA, which are based on the distance matrix, can be influenced by the pipeline used to generate the features [2]. | Statistical significance should be interpreted with caution and in the context of the pipeline used. |
Methodological Protocols for Beta Diversity Comparison
A standardized workflow for beta diversity analysis ensures that comparisons are meaningful.
- Generate Distance Matrices: From the rarefied feature tables generated by each pipeline, calculate a standard set of beta diversity distance matrices. Key metrics include:
- Bray-Curtis Dissimilarity: Abundance-weighted, very common in microbiome studies [90] [91].
- Jaccard Distance: Presence-absence-based, useful for focusing on species turnover [90].
- UniFrac Distance: Phylogenetic-based; both weighted (abundance-aware) and unweighted (presence-absence) versions should be used [91].
- Ordination and Visualization: Perform Principal Coordinates Analysis (PCoA) on the distance matrices to reduce dimensionality and visualize sample clustering in 2D or 3D plots [90].
- Statistical Testing: Use PERMANOVA (adonis) to test whether the centroids of pre-defined sample groups (e.g., healthy vs. disease) are statistically different. Use tests like ANOSIM to check for differences in group dispersions [90].
The following workflow diagram summarizes the key experimental steps for comparing beta diversity across pipelines:
The Scientist's Toolkit: Essential Research Reagents & Materials
Table 4: Essential Tools for Microbiome Diversity Analysis
| Tool / Reagent | Function in Analysis |
|---|---|
| 16S rRNA Gene Primers | Target-specific amplification of variable regions (e.g., V3-V4) from complex microbial DNA, defining the scope of the study. |
| Reference Database (e.g., SILVA, Greengenes) | Used for taxonomic assignment of sequences; the version and choice of database significantly impact results [2]. |
| QIIME2 Core Metrics Phylogenetic Script | An all-in-one script that performs rarefaction, calculates multiple alpha/beta diversity metrics, and generates PCoA plots [85]. |
| Rarefied Feature Table | A normalized table where all samples have been subsampled to the same sequencing depth, crucial for comparing diversity metrics without sequencing depth bias [85]. |
| Rooted Phylogenetic Tree | Essential for calculating phylogenetic diversity metrics like Faith's PD and UniFrac distances [85]. |
Quantifying Differences in Taxonomic Abundance and Composition
In the field of microbiome research, the selection of bioinformatic pipelines for analyzing 16S rRNA gene amplicon sequencing data represents a critical decision point that directly impacts biological interpretations. The ongoing controversy regarding the comparability of different analysis platforms and the lack of universally recognized standards present significant challenges for both basic and translational research [1]. Within this context, this guide provides an objective performance comparison of three widely used bioinformatic packages—DADA2, MOTHUR, and QIIME2—focusing specifically on their influence on taxonomic abundance and composition metrics. The reproducibility of microbiome signatures derived from different analytical approaches is paramount for advancing the field and ensuring the translational potential of research findings [1]. As microbiome analysis becomes increasingly integrated into clinical and pharmaceutical development pipelines, understanding the quantitative impact of bioinformatic choices on taxonomic assignments is essential for researchers, scientists, and drug development professionals who rely on accurate microbial community profiling.
Methodological Approaches in Comparative Studies
Experimental Designs for Pipeline Benchmarking
Comparative studies evaluating bioinformatic pipelines typically employ two primary experimental approaches: using mock communities with known compositions and analyzing large-scale clinical datasets. Mock communities contain genomic DNA from precisely defined bacterial strains in known proportions, enabling researchers to assess the sensitivity and specificity of each pipeline by comparing results against expected compositions [14] [13]. This approach allows for direct measurement of error rates, spurious taxon detection, and quantitative accuracy. The second approach involves analyzing large clinical datasets (often numbering thousands of samples) to evaluate how pipelines perform under real-world conditions with natural microbial diversity and complexity [14] [13]. These studies typically compare the consistency of relative abundance estimates, alpha and beta diversity measures, and overall taxonomic assignments across different pipelines.
Most comparative studies maintain consistency in critical parameters across pipelines to isolate the effect of the bioinformatic algorithms themselves. This includes using the same reference databases (typically SILVA or Greengenes) for taxonomic assignment [2] [16], processing the same raw sequencing files (fastq), and applying similar quality control thresholds where possible. The analytical steps common to these comparisons include read quality filtering and trimming, merging of paired-end reads, chimera detection and removal, sequence clustering into Operational Taxonomic Units (OTUs) or resolution of Amplicon Sequence Variants (ASVs), and finally taxonomic classification [2].
Key Experimental Protocols
Benchmarking with Mock Communities: One comprehensive study used the Microbial Mock Community B (v5.1L) from BEI Resources, which contains DNA from 20 bacterial strains in equimolar proportions [14] [13]. This mock community presents 22 variant sequences (ASVs) in the V4 region of the 16S rRNA gene, corresponding to 19 OTUs when clustered at 97% identity. Pipelines were evaluated based on their ability to correctly identify expected taxa without generating spurious assignments, with performance measured via sensitivity (recall of expected taxa), specificity (avoidance of false positives), and accuracy in quantifying relative abundances.
Large-Scale Clinical Validation: Another study employed a dataset of 2,170 fecal samples from the multi-ethnic HELIUS study to compare six bioinformatic pipelines [14] [13]. This design tested pipeline performance on complex, real-world samples, focusing on consistency in microbial community profiles, differential abundance detection, and diversity measures. Researchers quantified pipeline agreement using metrics like Procrustes analysis of beta-diversity ordinations, correlation of relative abundance estimates, and consistency in detecting differentially abundant taxa between clinical groups.
Table 1: Key Experimental Datasets Used in Pipeline Comparisons
| Dataset Type | Composition/Source | Key Metrics Assessed | Reference |
|---|---|---|---|
| Mock Community | 20 bacterial strains, 22 ASVs | Sensitivity, specificity, spurious OTU/ASV detection | [14] [13] |
| Gastric Mucosal Samples | 40 GC patients, 39 controls | Reproducibility of H. pylori status, diversity measures | [1] |
| Human Fecal Samples | 40 subjects with cognitive assessment | Relative abundance differences, taxonomic consistency | [2] [16] |
| HELIUS Fecal Samples | 2,170 multi-ethnic individuals | Alpha/beta diversity, specificity/sensitivity balance | [14] [13] |
Comparative Performance Analysis
Taxonomic Abundance and Composition Differences
Quantitative comparisons reveal that while different pipelines generally identify similar major taxa, significant differences emerge in relative abundance estimates. A systematic evaluation of four commonly used pipelines (QIIME2, Bioconductor, UPARSE, and MOTHUR) run on 40 human fecal samples found that taxa assignments were consistent at both phylum and genus levels across all pipelines, but statistically significant differences in relative abundance were detected for all phyla (p < 0.013) and for the majority of the most abundant genera (p < 0.028) [2] [16]. For instance, the genus Bacteroides showed considerable variation in abundance estimates across pipelines: QIIME2 (24.5%), Bioconductor (24.6%), UPARSE-Linux (23.6%), UPARSE-Mac (20.6%), MOTHUR-Linux (22.2%), and MOTHUR-Mac (21.6%) [16].
The choice between ASV-based (DADA2, QIIME2-Deblur, USEARCH-UNOISE3) and OTU-based (MOTHUR, USEARCH-UPARSE, QIIME-uclust) approaches significantly influences observed richness and diversity measures. ASV-based methods typically yield higher resolution by distinguishing sequences with single-nucleotide differences, while OTU-based methods cluster sequences at a defined similarity threshold (typically 97%) [14]. This fundamental methodological difference directly impacts downstream analyses, particularly for rare taxa that might be merged into larger OTUs or retained as distinct ASVs.
Benchmarking against mock communities with known composition provides crucial insights into the accuracy of different pipelines. A comprehensive comparison of six bioinformatic pipelines found that DADA2 offered the best sensitivity for detecting expected taxa, but at the expense of decreased specificity compared to USEARCH-UNOISE3 and QIIME2-Deblur [14]. USEARCH-UNOISE3 demonstrated the best balance between resolution and specificity, while OTU-level USEARCH-UPARSE and MOTHUR performed well but with lower specificity than ASV-level pipelines [14]. Notably, QIIME-uclust produced a large number of spurious OTUs and inflated alpha-diversity measures, leading researchers to recommend against its use in future studies [14].
The reproducibility of results across independent research groups using different pipelines was evaluated in a study comparing gastric mucosal microbiome compositions. Five independent research groups applied three distinct bioinformatic packages (DADA2, MOTHUR, and QIIME2) to the same dataset of gastric biopsy samples from gastric cancer patients and controls [1]. The study found that regardless of the protocol used, Helicobacter pylori status, microbial diversity, and relative bacterial abundance were reproducible across all platforms, although differences in performance were detected [1]. This finding underscores the broader applicability of microbiome analysis in clinical research when robust, well-documented pipelines are utilized.
Table 2: Performance Metrics of Different Bioinformatic Pipelines
| Pipeline | Clustering Method | Sensitivity | Specificity | Key Strengths | Notable Limitations |
|---|---|---|---|---|---|
| DADA2 | ASV-based | Highest | Moderate | Best sensitivity, high resolution | Decreased specificity versus alternatives |
| USEARCH-UNOISE3 | ASV-based | High | High | Best balance of resolution and specificity | - |
| QIIME2-Deblur | ASV-based | Moderate | High | Good specificity, integrated workflow | - |
| MOTHUR | OTU-based (97%) | Moderate | Moderate | Well-established, comprehensive toolkit | Lower specificity than ASV methods |
| USEARCH-UPARSE | OTU-based (97%) | Moderate | Moderate | Good performance for OTU approach | Lower specificity than ASV methods |
| QIIME-uclust | OTU-based (97%) | Low | Low | - | Many spurious OTUs, inflates diversity |
Technical Considerations and Pipeline Selection Guidelines
Impact of Analysis Parameters on Results
Beyond the choice of pipeline itself, specific analytical parameters significantly influence taxonomic abundance and composition results. The decision to use pooled versus non-pooled sample processing in DADA2 substantially affects observed richness; the pooled option (pool=TRUE) allows inclusion of singletons across the entire dataset, resulting in higher ASV counts compared to the default non-pooled approach (pool=FALSE) which analyzes samples individually and discards singletons [84]. This distinction is particularly important for studies interested in rare taxa, as the non-pooled approach may systematically undersample low-abundance community members.
The choice of reference database for taxonomic assignment (e.g., SILVA, Greengenes, RDP) also impacts results, though one study found that alignment of filtered sequences to different taxonomic databases had only a limited impact on taxonomic assignment and thus on global analytical outcomes [1]. Additionally, operating system environment (Linux vs. Mac OS) has been shown to produce minimal differences for QIIME2 and Bioconductor, while UPARSE and MOTHUR reported only slight variations between OS platforms [2] [16].
Practical Implementation Guidelines
For researchers selecting among bioinformatic pipelines for specific applications, several evidence-based recommendations emerge from comparative studies:
For maximal sensitivity in detecting taxa, particularly rare community members, DADA2 is recommended, though researchers should be aware of its somewhat lower specificity [14].
For balanced performance with good sensitivity and specificity, USEARCH-UNOISE3 provides an optimal combination of resolution and accuracy [14].
For clinical applications where reproducibility is paramount, multiple pipelines applied to the same dataset can confirm robust findings, as demonstrated by the consistent identification of H. pylori status across different platforms [1].
For comparative studies or meta-analyses, harmonization of bioinformatic pipelines is essential, as studies using different pipelines cannot be directly compared due to systematic differences in relative abundance estimation [2] [16].
For researchers prioritizing computational efficiency, newer pipelines like LotuS2 offer substantially faster processing times (29x faster on average in benchmarks) while maintaining or improving accuracy in taxonomic assignment [8].
It is critical to document all pipeline parameters and quality control steps thoroughly to ensure reproducibility, as variations in these settings can significantly impact results [1]. Furthermore, researchers should consider whether the higher resolution of ASV-based methods is necessary for their specific research questions, as OTU-based methods may provide sufficient taxonomic resolution for some applications while being computationally more efficient.
The following diagram illustrates the key decision points and considerations when selecting among bioinformatic pipelines for 16S rRNA analysis, based on the comparative evidence:
Essential Research Reagents and Tools
Table 3: Key Research Reagents and Computational Tools for 16S rRNA Analysis
| Resource Type | Specific Examples | Primary Function in Analysis |
|---|---|---|
| Reference Databases | SILVA, Greengenes, RDP | Taxonomic classification of sequences |
| Mock Communities | Microbial Mock Community B (BEI Resources) | Pipeline validation and accuracy assessment |
| Quality Control Tools | USEARCH, Trimmomatic, FastQC | Read quality filtering and processing |
| Clustering Algorithms | DADA2, UNOISE3, Deblur, UCLUST | ASV/OTU formation from sequence data |
| Full Pipeline Platforms | QIIME2, MOTHUR, LotuS2 | Integrated analysis workflows |
| Visualization Packages | Phyloseq, CoMA, QIIME2 view | Data exploration and result interpretation |
The quantitative comparison of DADA2, MOTHUR, and QIIME2 reveals that while all three pipelines can generate biologically meaningful insights, they differ systematically in their estimates of taxonomic abundance and composition. ASV-based methods like DADA2 provide higher resolution, while OTU-based approaches like MOTHUR offer established workflows with slightly lower specificity. The emerging consensus suggests that ASV-based methods generally provide superior accuracy, particularly for detecting rare taxa and quantifying subtle community differences. However, the reproducibility of major findings—such as H. pylori status in gastric samples or overall community patterns in gut microbiota—across different pipelines [1] provides confidence in the robustness of microbiome research when appropriate analytical care is taken. For researchers and drug development professionals, selection among these pipelines should be guided by specific research questions, required resolution, and computational resources, with the understanding that consistent application of a single well-validated pipeline is preferable for within-study comparisons. As the field advances toward greater standardization, the systematic quantification of pipeline differences presented in this guide provides a foundation for making informed analytical decisions in microbiome research.
Microbiome research has become a cornerstone of modern biomedical science, offering profound insights into human health and disease. However, the field faces a significant challenge: the potential for analytical methodologies themselves to influence research outcomes. Researchers must navigate a complex landscape of bioinformatic pipelines, each with distinct algorithms and processing steps, raising critical questions about the reproducibility and comparability of findings across different studies. This is particularly crucial for drug development professionals who rely on consistent, verifiable results to inform diagnostic and therapeutic strategies.
This case study examines a central question: Can different, commonly used bioinformatic pipelines applied to the same biological dataset generate consistent conclusions about disease associations? Through a systematic analysis of multiple pipelines applied to identical disease cohort data, we demonstrate that while technical variations exist, core biological signatures remain robust and identifiable across platforms. This finding has important implications for the validation of microbiome-based biomarkers and their translation into clinical practice.
Comparative Performance Analysis of Bioinformatics Pipelines
Key Findings from Cross-Pipeline Validation Studies
Recent rigorous comparative studies have systematically evaluated the performance of major bioinformatics pipelines when applied to identical disease cohort data. The consistency of biological conclusions, despite analytical variations, is demonstrated by the key findings summarized in the table below.
Table 1: Key Findings from Cross-Pipeline Validation Studies
| Aspect Evaluated | Findings | Implication for Consistency |
|---|---|---|
| Helicobacter pylori Status | 100% reproducible across DADA2, MOTHUR, and QIIME2 on gastric cancer biopsies [1] | High-level pathogen detection is robust to pipeline choice. |
| Microbial Diversity | Reproducible patterns across all platforms despite performance differences [1] | Ecological conclusions (e.g., diversity shifts) are stable. |
| Relative Abundance | Major taxa showed consistent trends; minor variations in abundance estimation [1] [2] | Core community structure is reliably captured. |
| Taxonomic Database | Limited impact from using RDP, Greengenes, or SILVA on global outcomes [1] | Taxonomic assignment is not critically dependent on a specific database. |
| Operating System (OS) | Identical outputs for QIIME2/Bioconductor on Linux/Mac; minimal differences for UPARSE/mothur [2] | Computational environment has negligible effect for most pipelines. |
The evidence indicates that independent expert groups, using different analysis approaches on the same dataset, can generate comparable biological conclusions [1]. This reproducibility underscores the broader applicability of microbiome analysis in clinical research, provided that robust, well-documented pipelines are used.
Quantitative Comparison of Taxonomic Output
While core biological findings are consistent, the choice of pipeline does influence specific outputs, such as the relative abundance of individual taxa. The following table presents a quantitative comparison from a study of 40 human stool samples, highlighting variations in abundance estimates for the most common bacterial phyla and the genus Bacteroides.
Table 2: Relative Abundance (%) of Major Taxa Across Pipelines and Operating Systems (N=40) [2]
| Taxon / Pipeline | QIIME2 | Bioconductor | UPARSE (Linux) | UPARSE (Mac) | mothur (Linux) | mothur (Mac) |
|---|---|---|---|---|---|---|
| Bacteroidetes | 24.5 | 24.6 | 23.6 | 20.6 | 22.2 | 21.6 |
| Firmicutes | 63.5 | 63.4 | 66.8 | 69.6 | 67.7 | 68.2 |
| Proteobacteria | 5.8 | 5.8 | 3.6 | 3.9 | 4.2 | 4.3 |
| Actinobacteria | 4.2 | 4.2 | 4.3 | 4.3 | 4.3 | 4.3 |
| Verruscomicrobia | 1.0 | 1.0 | 1.1 | 1.1 | 1.1 | 1.1 |
Statistical analysis confirmed that these differences in relative abundance were significant for all major phyla and for the majority of the most abundant genera [2]. This confirms that while broad patterns are consistent, direct comparison of numerical abundance values from studies using different pipelines should be done with caution. A harmonization procedure is needed to facilitate direct meta-analyses across the field.
Experimental Protocols for Pipeline Comparison
Multi-Pipeline Gastric Microbiome Study
Objective: To investigate how the performance of DADA2, MOTHUR, and QIIME2 impacts the final results of mucosal microbiome signatures in gastric cancer [1].
Source Data: The study utilized 16S rRNA gene raw sequencing data (V1-V2 hypervariable regions) from gastric biopsy samples. The cohort consisted of clinically well-defined gastric cancer (GC) patients (n=40, with and without Helicobacter pylori infection) and controls (n=39, with and without H. pylori infection) [1].
Experimental Workflow: Five independent research groups applied the three different bioinformatics packages (DADA2, MOTHUR, and QIIME2) to the same subset of fastQ files. The specific protocols for each pipeline were as follows:
- DADA2 (within QIIME2 or Bioconductor): This pipeline uses a model-based method to correct sequencing errors and infers exact amplicon sequence variants (ASVs). The core algorithm involves quality filtering, dereplication, learning error rates, sample inference, and merging paired-end reads, resulting in a table of ASVs without clustering [2].
- MOTHUR: This pipeline follows a procedure that includes creating contigs from paired-end reads, screening sequences for length and ambiguous bases, aligning sequences to a reference database (e.g., SILVA), pre-clustering, and removing chimeras. It typically outputs Operational Taxonomic Units (OTUs) clustered at a 97% similarity threshold [92] [2]. The specific steps are:
contigs.sh→screen.sh→unique.sh→silva_ref.sh→align.sh→screen2.sh→filter.sh→precluster.sh→chimera.sh→classify.sh[92]. - QIIME2: This platform can incorporate multiple plugins. For this analysis, the DADA2 plugin was likely used for denoising and generating ASVs. The process involves importing demultiplexed sequences, quality control, denoising via DADA2, merging paired-end reads, and taxonomic assignment against a reference database [92] [2].
Outcome Measures: The key metrics for comparison across pipelines were H. pylori infection status, measures of microbial alpha- and beta-diversity, and the relative abundance of bacterial taxa. The impact of using different taxonomic databases (Ribosomal Database Project, Greengenes, and SILVA) was also assessed [1].
Figure 1: Multi-Pipeline Validation Workflow. Five independent groups analyzed the same gastric microbiome dataset using three different bioinformatic pipelines, finding consistent results for key biological metrics [1].
Cross-Platform Consistency Study
Objective: To evaluate whether different bioinformatic pipelines and operating systems influence the taxonomic classification of the human gut microbiota [2].
Source Data: Forty human stool samples were collected from a cohort study on brain aging. The V3-V4 regions of the 16S rRNA gene were amplified, and sequencing was performed on an Illumina MiSeq platform [2].
Experimental Workflow: The same dataset was processed using four different pipelines run on two operating systems (Linux and Mac OS).
- Pipelines: QIIME2, Bioconductor, UPARSE, and mothur.
- Bioinformatic Units: QIIME2 and Bioconductor were used to infer Amplicon Sequence Variants (ASVs), while UPARSE and mothur generated Operational Taxonomic Units (OTUs).
- Consistency Check: The SILVA 132 reference database was applied uniformly for all taxonomic assignments to isolate the effect of the pipeline algorithm.
- Comparison: The resulting taxonomic assignments at the phylum and genus levels, along with relative abundances, were compared across all pipeline-OS combinations using statistical tests (Friedman rank sum test) [2].
Successful and reproducible microbiome analysis relies on a suite of bioinformatic tools and reference materials. The table below details key components of the research toolkit as utilized in the featured experiments.
Table 3: Essential Research Reagents and Resources for Microbiome Analysis
| Item Name | Function/Description | Examples from Studies |
|---|---|---|
| Bioinformatic Pipelines | Software suites for end-to-end processing of raw sequencing data into biological insights. | DADA2, MOTHUR, QIIME2 [1] [2] |
| Reference Databases | Curated collections of gene sequences used for taxonomic classification of unknown sequences. | SILVA, Greengenes, Ribosomal Database Project (RDP) [1] [2] |
| Cloud Computing Platform | Provides scalable storage and powerful computation for large microbiome datasets. | Amazon Web Services (AWS) with S3 for storage and EC2 for analysis [83] |
| Machine Learning Algorithms | Used to build predictive models from complex microbiome data for disease diagnosis. | Ridge Regression, Random Forest, Lasso [93] [94] |
| Stool DNA Extraction Kit | Standardized kit for isolating high-quality microbial DNA from complex stool samples. | QIAamp DNA Stool Mini Kit (Qiagen) [2] |
| 16S rRNA Gene Primers | Oligonucleotides designed to amplify specific hypervariable regions of the bacterial 16S gene. | Illumina 16S Metagenomic Sequencing Library Prep primers (V3-V4) [2] |
The integration of these tools into a coherent analysis pipeline, such as the Microbiome Data Analysis Pipeline using AWS (MAP-AWS) [83], provides a reliable and reproducible framework for conducting robust microbiome research that can be shared across research teams.
The collective evidence from these case studies affirms that core biological conclusions regarding disease-microbiome associations can remain consistent even when derived from different bioinformatic pipelines. The robust reproducibility of findings related to pathogen status, microbial diversity patterns, and major taxonomic shifts across DADA2, MOTHUR, and QIIME2 is a strong validation for the field [1]. This consistency provides confidence in the broader applicability of microbiome analysis in clinical and translational research.
However, consistency in biological conclusions does not equate to identical numerical outputs. Significant differences in the estimated relative abundance of specific taxa highlight that analytical variations are a critical consideration [2]. These discrepancies can arise from fundamental methodological differences, such as ASV inference versus OTU clustering, or variations in pre-processing steps like chimera removal and quality filtering [92]. Therefore, while the direction of biological effects is reliable, direct numerical comparison of abundance values from studies using different pipelines is not advisable without harmonization.
For the field to progress, especially in the context of drug development and clinical biomarker discovery, several best practices are recommended:
- Full Transparency: Complete documentation of the bioinformatic pipeline, including all software versions, parameters, and reference databases, is non-negotiable [1].
- Within-Study Consistency: For any given study or multi-stage trial, the same pipeline should be used throughout to ensure internal consistency.
- Validation and Harmonization: The development of methods to cross-calibrate results between major pipelines will be essential for meta-analyses and building universal diagnostic models [93] [94].
In conclusion, the microbiome research landscape is maturing. Acknowledging both the robustness of core biological findings and the nuances of analytical variations is key. By adhering to rigorous and transparent methodologies, researchers and drug developers can confidently leverage microbiome data to unlock new diagnostics and therapies.
Conclusion
Synthesizing the evidence from recent, rigorous comparisons, a central consensus emerges: while different bioinformatics pipelines like DADA2, QIIME2, and MOTHUR can produce variations in the estimated relative abundance of specific taxa and diversity measures, they demonstrate strong concordance for major biological conclusions. Reproducible identification of key clinical features, such as Helicobacter pylori status in gastric cancer studies, underscores the broader applicability of microbiome analysis in biomedical research. The critical factor for success is not the universal superiority of a single pipeline, but the consistent application of a well-documented, robust workflow. Future directions must prioritize the adoption of standardized reporting practices, enhanced provenance tracking as seen in QIIME2, and the development of validation frameworks that use multiple datasets to ensure findings are robust and translatable. For clinical and pharmaceutical research, this reliability is the bedrock upon which diagnostic biomarkers and therapeutic targets can be confidently discovered and validated.
References
- 1. Comparison of different microbiome analysis pipelines to ... [https://pubmed.ncbi.nlm.nih.gov/39873520/]
- 2. Comparison of Bioinformatics Pipelines and Operating ... [https://pmc.ncbi.nlm.nih.gov/articles/PMC7318847/]
- 3. DADA2 Pipeline Tutorial (1.16) [https://benjjneb.github.io/dada2/tutorial.html]
- 4. Metagenomic profiling pipelines improve taxonomic ... [https://www.nature.com/articles/s41598-023-40799-x]
- 5. How to Choose among the Methods? - User Support [https://forum.qiime2.org/t/how-to-choose-among-the-methods/527]
- 6. How to Analyze Amplicon Sequencing Data: Tools, Tips, ... [https://www.cd-genomics.com/resource-how-analyze-amplicon-sequencing-data.html]
- 7. Breaking the reproducibility barrier with standardized ... [https://journals.plos.org/plosbiology/article?id=10.1371/journal.pbio.3003358]
- 8. LotuS2: an ultrafast and highly accurate tool for amplicon ... [https://microbiomejournal.biomedcentral.com/articles/10.1186/s40168-022-01365-1]
- 9. HolomiRA: a reproducible pipeline for miRNA binding site ... [https://bmcbioinformatics.biomedcentral.com/articles/10.1186/s12859-025-06241-x]
- 10. Microbiome Informatics: OTU vs. ASV [https://www.zymoresearch.com/blogs/blog/microbiome-informatics-otu-vs-asv?srsltid=AfmBOoraL4Pfe3z8lSIBC_WkLQN6qunC6iupQyBpbqzJ6L2r885gRzg5]
- 11. OTU vs. ASV in Metagenomic Analysis [https://www.seqme.eu/en/blog/article/otu-vs-asv-in-metagenomic-analysis]
- 12. Ranking the biases: The choice of OTUs vs. ASVs in 16S ... [https://pmc.ncbi.nlm.nih.gov/articles/PMC8870492/]
- 13. Comparing bioinformatic pipelines for microbial 16S rRNA ... [https://pmc.ncbi.nlm.nih.gov/articles/PMC6964864/]
- 14. Comparing bioinformatic pipelines for microbial 16S rRNA ... [https://journals.plos.org/plosone/article?id=10.1371/journal.pone.0227434]
- 15. The choice of OTUs vs. ASVs in 16S rRNA amplicon data ... [https://journals.plos.org/plosone/article?id=10.1371/journal.pone.0264443]
- 16. Comparison of Bioinformatics Pipelines and Operating ... [https://www.frontiersin.org/journals/microbiology/articles/10.3389/fmicb.2020.01262/full]
- 17. ensuring rigour, reproducibility and relevance in the era of AI [https://pubmed.ncbi.nlm.nih.gov/40745489/]
- 18. Repeatability and reproducibility assessment in a large-scale ... [https://microbiomejournal.biomedcentral.com/articles/10.1186/s40168-020-00998-4]
- 19. From big data and experimental models to clinical trials [https://www.sciencedirect.com/science/article/pii/S0092867425001072]
- 20. Bioinformatics Pipeline For Sustainability [https://www.meegle.com/en_us/topics/bioinformatics-pipeline/bioinformatics-pipeline-for-sustainability]
- 21. iMAP: an integrated bioinformatics and visualization pipeline ... [https://bmcbioinformatics.biomedcentral.com/articles/10.1186/s12859-019-2965-4]
- 22. DADA2 in Mothur? [https://forum.mothur.org/t/dada2-in-mothur/19765]
- 23. of Comparison with Deblur - User Support - DADA Forum 2 QIIME 2 [https://forum.qiime2.org/t/comparison-of-dada2-with-deblur/3503]
- 24. Developing a Reproducible Microbiome Data Analysis ... [https://pmc.ncbi.nlm.nih.gov/articles/PMC6913755/]
- 25. GitHub - AspaLav/ qiime - 2 - dada 2 comparison [https://github.com/AspaLav/qiime2-dada2-comparison]
- 26. MetaScope: A High-Resolution Framework for Species-Level... | CoLab [https://colab.ws/articles/10.1101%2F2025.08.29.673160]
- 27. Building an amplicon sequence variant (ASV) table from ... [https://training.galaxyproject.org/training-material/topics/microbiome/tutorials/dada-16S/tutorial.html]
- 28. The unresolved struggle of 16S rRNA amplicon sequencing [https://pmc.ncbi.nlm.nih.gov/articles/PMC12076876/]
- 29. Qiime2 tutorial for Cris - Gabriel M. [https://guto-monteiro.com/blog/2025/blog-post-9/]
- 30. Conceptual overview of marker gene (i.e., amplicon) data ... [https://amplicon-docs.qiime2.org/en/2025.4/explanations/conceptual-overview.html]
- 31. QIIME 2 for experienced microbiome researchers [https://amplicon-docs.qiime2.org/en/latest/explanations/experienced-researchers.html]
- 32. Taxonomic classifiers [https://library.qiime2.org/data-resources]
- 33. Available Plugins [https://library.qiime2.org/plugins]
- 34. q2-feature-classifier [https://library.qiime2.org/plugins/qiime2/q2-feature-classifier/discussions]
- 35. MiSeq SOP [https://mothur.org/wiki/miseq_sop/]
- 36. cluster [https://mothur.org/wiki/cluster/]
- 37. cluster.fit🔗 - commands [https://mothur.org/wiki/cluster.fit/]
- 38. Customize your reference alignment for your favorite region [https://mothur.org/blog/2016/Customization-for-your-region/]
- 39. OTU-based approaches [https://mothur.org/wiki/otu-based_approaches/]
- 40. Research Note: Choice of microbiota database affects data ... [https://pmc.ncbi.nlm.nih.gov/articles/PMC9241040/]
- 41. SILVA, RDP, Greengenes, NCBI and OTT — how do these ... [https://bmcgenomics.biomedcentral.com/articles/10.1186/s12864-017-3501-4]
- 42. Benchmarking taxonomic assignments based on 16S rRNA ... [https://pmc.ncbi.nlm.nih.gov/articles/PMC5967554/]
- 43. quality-control - Microbiome marker gene analysis with QIIME 2 [https://amplicon-docs.qiime2.org/en/2025.4/references/plugins/quality-control.html]
- 44. Analysis of Salivary Microbiota Characteristics in Patients With ... [https://pmc.ncbi.nlm.nih.gov/articles/PMC10752765/]
- 45. : Easy Microbiome Analysis Platform | BMC Bioinformatics EzMAP [https://bmcbioinformatics.biomedcentral.com/articles/10.1186/s12859-021-04106-7]
- 46. GitHub - gnanibioinfo/ EzMAP [https://github.com/gnanibioinfo/EzMAP]
- 47. Core concepts — QIIME 2 2024.10.1 documentation [https://docs.qiime2.org/2024.10/concepts/]
- 48. 生物信息学中的可重复性研究原创 [https://blog.csdn.net/weshengxin/article/details/135470143]
- 49. Comparison of different microbiome analysis pipelines to ... [https://hub.tmu.edu.tw/en/publications/comparison-of-different-microbiome-analysis-pipelines-to-validate/]
- 50. DADA2: Fast and accurate sample inference from amplicon ... [https://benjjneb.github.io/dada2/]
- 51. How long it takes for learning error rates step of DADA2? [https://forum.qiime2.org/t/how-long-it-takes-for-learning-error-rates-step-of-dada2/32193]
- 52. DADA2 takes too much time for analysis - Technical Support [https://forum.qiime2.org/t/dada2-takes-too-much-time-for-analysis/26307]
- 53. Cross-comparison of gut metagenomic profiling strategies [https://www.nature.com/articles/s42003-024-07158-6]
- 54. Please Help! Truncation length and interpretation of ... [https://forum.qiime2.org/t/please-help-truncation-length-and-interpretation-of-denoising-stats/17038]
- 55. Effect of primer removal on chimera detection in DADA2 [https://forum.qiime2.org/t/effect-of-primer-removal-on-chimera-detection-in-dada2/33605]
- 56. DADA2 Error Rate Plots · Issue #1963 [https://github.com/benjjneb/dada2/issues/1963]
- 57. Differences in chimera detection based on dataset structure [https://github.com/benjjneb/dada2/issues/1942]
- 58. Assessing and mitigating batch effects in large-scale omics ... [https://genomebiology.biomedcentral.com/articles/10.1186/s13059-024-03401-9]
- 59. Compatibility of whole-genome sequencing data from Illumina ... [https://pmc.ncbi.nlm.nih.gov/articles/PMC12046094/]
- 60. Comparing NGS Platforms: Ion Torrent vs. Illumina [https://www.biotechveritas.com/blog/ngs]
- 61. A comparison of Illumina and Ion Torrent sequencing ... [https://bmcgenomics.biomedcentral.com/articles/10.1186/s12864-017-4011-0]
- 62. Performance Comparison of Illumina and Ion Torrent Next ... [https://pmc.ncbi.nlm.nih.gov/articles/PMC4249215/]
- 63. Next-generation sequencing applications in food science [https://pmc.ncbi.nlm.nih.gov/articles/PMC12405390/]
- 64. Comparative analyses of Ion Torrent V4 and Illumina V3 ... [https://www.sciencedirect.com/science/article/pii/S2468227620300168]
- 65. Interpretations of Environmental Microbial Community ... [https://www.frontiersin.org/journals/microbiology/articles/10.3389/fmicb.2020.550420/full]
- 66. zAMP and zAMPExplorer: reproducible scalable amplicon- ... [https://pmc.ncbi.nlm.nih.gov/articles/PMC12603355/]
- 67. Evaluating the efficiency of 16S-ITS-23S operon ... [https://www.nature.com/articles/s41598-024-83410-7]
- 68. A Comprehensive Evaluation of Taxonomic Classifiers in ... [https://pmc.ncbi.nlm.nih.gov/articles/PMC12415807/]
- 69. mothur and QIIME [https://mothur.org/blog/2016/mothur-and-qiime/]
- 70. Reproducible, interactive, scalable and extensible ... [https://pmc.ncbi.nlm.nih.gov/articles/PMC7015180/]
- 71. Comparison of Mothur and QIIME for the Analysis ... [https://www.frontiersin.org/journals/microbiology/articles/10.3389/fmicb.2018.03010/full]
- 72. Problem with biom - Technical Support [https://forum.qiime2.org/t/problem-with-biom/27619]
- 73. Use QIIME 2 files in mothur? [https://forum.mothur.org/t/use-qiime-2-files-in-mothur/19604]
- 74. import mothur files to QIIME2 - User Support - QIIME 2 Forum [https://forum.qiime2.org/t/import-mothur-files-to-qiime2/9966]
- 75. CSV to a qiime2 readable format - User Support [https://forum.qiime2.org/t/csv-to-a-qiime2-readable-format/2284]
- 76. Metadata in QIIME 2 [https://docs.qiime2.org/2024.10/tutorials/metadata/]
- 77. QIIME2 enhances multi-amplicon sequencing data analysis [https://pubmed.ncbi.nlm.nih.gov/40711419/]
- 78. Sensitivity and specificity [https://en.wikipedia.org/wiki/Sensitivity_and_specificity]
- 79. Comparing bioinformatic pipelines for microbial 16S rRNA ... [https://heliusstudy.nl/publicatie/comparing-bioinformatic-pipelines-for-microbial-16s-rrna-amplicon-sequencing/]
- 80. Diagnostic Testing Accuracy: Sensitivity, Specificity, Predictive ... [https://www.ncbi.nlm.nih.gov/books/NBK557491/]
- 81. Sensitivity, Specificity, and Predictive Values: Foundations, ... [https://www.frontiersin.org/journals/public-health/articles/10.3389/fpubh.2017.00307/full]
- 82. MetaPro: a scalable and reproducible data processing and ... [https://microbiomejournal.biomedcentral.com/articles/10.1186/s40168-023-01562-6]
- 83. Developing a Reproducible Microbiome Data Analysis ... [https://medinform.jmir.org/2019/4/e14667/]
- 84. Method comparison - differences in observed richness [https://forum.qiime2.org/t/method-comparison-differences-in-observed-richness/8788]
- 85. Lesson 5: Microbial diversity, alpha rarefaction, alpha diversity [https://bioinformatics.ccr.cancer.gov/docs/qiime2/Lesson5/]
- 86. Qiime2 outperforming Mothur? [https://forum.mothur.org/t/qiime2-outperforming-mothur/19768]
- 87. Understanding Alpha Diversity: What It Is and Why It Matters [https://www.cd-genomics.com/resource-understanding-alpha-diversity-what-it-is-why-it-matters.html]
- 88. Alpha Diversity [https://docs.onecodex.com/en/articles/4136553-alpha-diversity]
- 89. Beta diversity [https://en.wikipedia.org/wiki/Beta_diversity]
- 90. What is Beta Diversity [https://www.cd-genomics.com/resource-what-beta-diversity.html]
- 91. Beta diversity metrics [https://www.drive5.com/usearch/manual/beta_metrics.html]
- 92. Comparing QIIME2 and Mothur 16S QC and Filtering [https://ahuffmyer.github.io/ASH_Putnam_Lab_Notebook/Comparing-QIIME2-and-Mothur-16S-QC-and-Filtering/]
- 93. Best practices for developing microbiome-based disease ... [https://pmc.ncbi.nlm.nih.gov/articles/PMC11980492/]
- 94. Pooled analysis of 3741 stool metagenomes from 18 ... [https://www.nature.com/articles/s41591-025-03693-9]