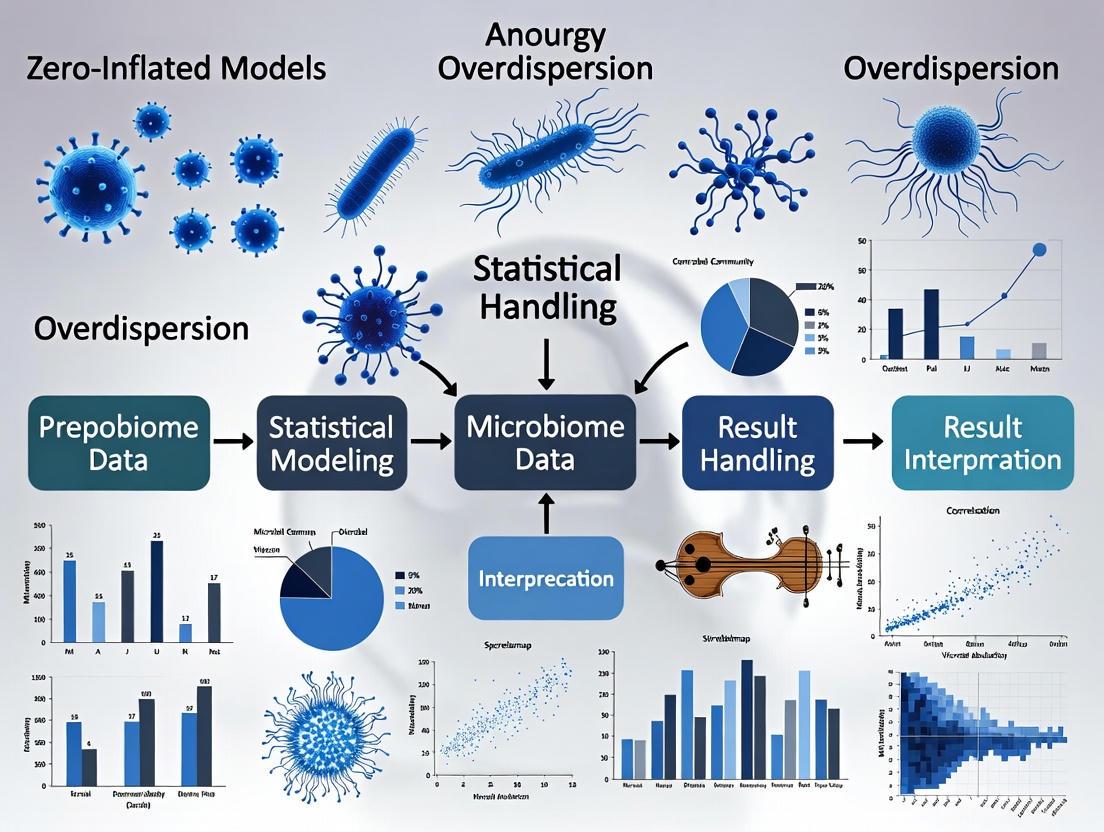
Navigating Zero-Inflation and Overdispersion: A Statistical Guide for Robust Microbiome Data Analysis
Microbiome data from high-throughput sequencing are characterized by zero-inflation and overdispersion, posing significant challenges for robust statistical analysis in biomedical and clinical research.
Navigating Zero-Inflation and Overdispersion: A Statistical Guide for Robust Microbiome Data Analysis
Abstract
Microbiome data from high-throughput sequencing are characterized by zero-inflation and overdispersion, posing significant challenges for robust statistical analysis in biomedical and clinical research. This article provides a comprehensive guide for researchers and drug development professionals, addressing these data intricacies from foundational concepts to advanced methodologies. We explore the sources and implications of these characteristics, detail a suite of specialized statistical models—including zero-inflated and hurdle models—for differential abundance and integrative analysis, and offer best practices for data preprocessing and model selection. Furthermore, we review validation techniques and comparative performance of competing methods through simulation studies and real-world applications, empowering scientists to derive reliable biological insights from their microbiome studies.
The Nature of the Challenge: Understanding Zero-Inflation and Overdispersion in Microbiome Data
Frequently Asked Questions
1. What are the main types of high-throughput sequencing for microbiome studies? Researchers primarily use two approaches [1] [2]:
- Targeted Amplicon Sequencing (e.g., 16S rRNA, ITS): This method uses PCR to amplify and sequence specific marker genes. It is a cost-effective and high-throughput method for profiling microbial community composition and diversity, typically down to the genus level.
- Shotgun Metagenomics: This approach involves sequencing all the DNA fragments in a sample. It is more expensive but provides a higher-resolution view of the community, enabling species- or strain-level identification and insights into the functional potential (gene content) of the microbiome.
2. Why is microbiome data often characterized by an abundance of zeros? The zeros in a microbiome dataset, known as zero-inflation, arise from two main processes [3]:
- Structural Zeros: These represent a true absence of a microbe in a sample because the subject is not at risk for hosting that particular taxon (e.g., an obligate anaerobe in an oxygen-rich environment).
- Sampling Zeros: These are false absences that occur due to sampling variability, where a microbe is present in the ecosystem but was not captured in the specific sample taken, often because it is in very low abundance.
3. What causes overdispersion in microbiome sequencing data? Overdispersion occurs when the variance in the data is much larger than the mean. In microbiome studies, this is common and can be caused by [3]:
- Biological Variation: Genuine, large differences in microbial abundances between different subjects or sample groups.
- Technical Variation: Artifacts introduced during the experimental workflow, including PCR amplification bias, sequencing depth differences, and contamination from low-biomass samples [1] [4].
4. What are common troubleshooting issues in sequencing preparation? Library preparation is a critical source of potential problems. Common issues include [5]:
- Low Library Yield: Often caused by poor input DNA/RNA quality, contaminants inhibiting enzymes, or inaccurate quantification.
- Adapter Dimers: Sharp peaks at ~70-90 bp in an electropherogram indicate inefficient ligation or overly aggressive purification, where adapter molecules ligate to each other instead of the target DNA.
- Over-amplification: Too many PCR cycles can introduce duplicates and size biases, reducing library complexity.
Troubleshooting Guides
Problem: High Levels of Zero-Inflation and Overdispersion in Count Data Background: Standard statistical models like the Poisson regression assume the mean and variance of count data (e.g., OTU or ASV counts) are equal. Microbiome data consistently violate this assumption, requiring specialized models [3] [6].
Solution: Implement Advanced Statistical Models The table below summarizes appropriate models for analyzing overdispersed and zero-inflated count data.
| Model | Best For | Key Assumption | Interpretation |
|---|---|---|---|
| Negative Binomial (NB) | Overdispersed data without excess zeros. [3] | All zeros are sampling zeros. [3] | Coefficients can be exponentiated as Rate Ratios (RR). [3] |
| Zero-Inflated Negative Binomial (ZINB) | Data with both zero-inflation and overdispersion. [3] [6] | Zeros come from two latent groups: a "always-zero" group and an "at-risk" group. [3] | Logistic model part outputs Odds Ratios (OR) for structural zeros; count model part outputs RR for counts. [3] |
| Hurdle Model (HUNB) | Data with both zero-inflation and overdispersion. [3] | All zeros are generated from a single, structural process. [3] | Logistic model discriminates zeros from non-zeros; a truncated count model (e.g., truncated NB) models positive counts. [3] |
How to Choose: The choice between ZINB and Hurdle models should depend on your research question and the assumed nature of the zeros. The ZINB model is conceptually useful when your population logically contains a sub-group that is not at risk for a microbe (e.g., non-smokers in a study of smoking frequency). The Hurdle model is appropriate when the entire population is at risk, but a process determines whether a count is zero or positive (e.g., the number of non-smoking days among smokers) [3].
Problem: Inconsistent Microbiota Profiles Due to Technical Bias Background: The choice of sequencing platform, the hypervariable region of the 16S rRNA gene that is targeted, and the bioinformatic pipeline used for analysis can all introduce variability, making results across studies difficult to compare [4].
Solution: Adopt Rigorous Experimental and Analytical Controls
- Wet-Lab Controls: Always include control samples in your sequencing run to identify contamination and artifacts [1].
- Water Blank: Controls for nucleic acid contamination in your reagents ("kitome").
- Mock Community: A mixture of DNA from known microbes. This is essential for validating your entire workflow, from DNA extraction to bioinformatic analysis, and for identifying systematic biases [1].
- Bioinformatic Controls: To improve consistency, consider moving beyond short-read amplicon sequencing.
- Full-length 16S rRNA sequencing using third-generation sequencers (PacBio, Nanopore) can provide species-level resolution that short reads miss [4] [2].
- Paired-end sequencing for 16S amplicons is critical. Ensure the read length is sufficient for the paired reads to overlap completely, which reduces uncorrected sequence errors [1].
Research Reagent Solutions
The table below lists essential materials and their functions for a standard 16S rRNA amplicon sequencing workflow.
| Item | Function / Explanation |
|---|---|
| Primers (e.g., V4 16S) [1] | Target and amplify a specific hypervariable region of the bacterial 16S rRNA gene for sequencing. |
| Mock Community [1] | A defined mix of genomic DNA from known bacterial strains. Serves as a positive control to assess accuracy, precision, and bias in the wet-lab and bioinformatic pipeline. |
| Demethylase Enzymes [7] | Used in specialized tRNA-seq (DM-tRNA-seq) to remove specific tRNA modifications, allowing for more accurate sequencing of tRNA transcripts and enabling physiological studies of the microbiome. |
| Thermostable Group II Intron Reverse Transcriptase (TGIRT) [7] | A reverse transcriptase that can read through rigid structures and many base modifications in RNA, crucial for obtaining full-length sequences in tRNA-seq and other modification-rich contexts. |
Experimental Workflows and Data Relationships
The following diagram illustrates the logical pathway from raw sequencing data through the characteristic challenges to the final statistical modeling options.
The workflow for obtaining microbiome data is complex, and choices at the wet-lab stage directly influence the characteristics of the final dataset. The diagram below outlines a standard 16S rRNA amplicon sequencing workflow, highlighting key steps where technical variation and bias can be introduced.
Frequently Asked Questions (FAQs)
1. What are the fundamental types of zeros in microbiome sequence count data? Zeros in microbiome data are not all the same; they arise from distinct processes. The primary classification includes four types [8]:
- Sampling Zeros: Arise due to limited sequencing depth. A microbe is present in a sample but not detected because not enough reads were collected.
- Biological Zeros: Represent the true absence of a sequence from a biological system.
- Technical Zeros (Partial): Caused by experimental procedures that partially reduce countable sequences (e.g., difficulty amplifying GC-rich genes).
- Technical Zeros (Complete): Caused by experimental procedures that completely prevent a sequence from being counted (e.g., batch effects or PCR amplification bias). This is the process that zero-inflated models specifically address.
2. Why is it critical to distinguish between technical and biological zeros? Incorrectly classifying zeros can lead to flawed biological interpretations [8] [9]. Mistaking a technical zero (a microbe that was present but undetected) for a biological zero (a genuinely absent microbe) can cause false negatives in differential abundance analysis and distort the understanding of microbial community structure and its association with diseases or environmental conditions.
3. What are the main statistical challenges posed by zero-inflated microbiome data? Microbiome data is characterized by several features that complicate analysis [10] [11]:
- High Dimensionality: The number of taxa (features) vastly exceeds the number of samples.
- Compositionality: Data represents relative, not absolute, abundances.
- Over-dispersion: The variance in the data is much larger than the mean.
- Sparsity (Zero-inflation): A large proportion (often 70-95%) of the data points are zeros [12] [8]. These characteristics can cause standard statistical methods to produce invalid or misleading results, such as inflated false discovery rates.
4. How do zero-handling methods impact the identification of differentially abundant taxa? The choice of method significantly impacts results. Different statistical models can disagree substantially on which sequences are the most differentially abundant [8] [13]. For example, a standard negative binomial model might identify a sequence with a presence-absence pattern as differentially expressed, while a zero-inflated negative binomial model might attribute the pattern to "differential zero-inflation" between conditions and not call it significant. Using a consensus of multiple methods is often recommended for robust conclusions [13].
Troubleshooting Guides
Problem: My differential abundance analysis is yielding inconsistent results.
Potential Cause: The analysis is not adequately accounting for the specific types of zeros and over-dispersion in your dataset.
Solution: Implement a strategy that combines multiple approaches to address different aspects of the data.
Step 1: Pre-processing and Filtering Apply a prevalence filter to remove rare taxa that are uninformative for group comparisons. For instance, filter out any taxa found in fewer than 10% of samples within a dataset [13]. This reduces the multiple testing burden and removes some noise.
Step 2: Address Zero-Inflation and Group-Wise Structured Zeros Use a combined testing approach [12]:
- Use a method like DESeq2-ZINBWaVE to handle general zero-inflation and control the false discovery rate. This method incorporates observation weights based on the ZINBWaVE model.
- Separately, use DESeq2 alone to properly handle the problem of "group-wise structured zeros" (also known as perfect separation), where a taxon has all zero counts in one group and non-zero counts in another. DESeq2's penalized likelihood estimation can provide finite parameter estimates in this scenario.
Step 3: Normalize Data Appropriately Choose a normalization method that mitigates the effects of uneven sequencing depth and compositionality. Common methods include:
Step 4: Compare Results with Compositional-Aware Methods For a more robust biological interpretation, compare your results with those from compositionally aware tools like ALDEx2 or ANCOM-II, which have been shown to produce more consistent results across studies [13].
Problem: I need to denoise my microbiome data to better recover the true biological signal.
Potential Cause: The observed count data are a noisy representation of the true microbial abundance due to technical variation, including technical zeros and uneven sequencing depth.
Solution: Use a denoising method specifically designed for microbiome data's zero-inflated and over-dispersed nature.
- Protocol: Denoising with mbDenoise [9]
mbDenoise is based on a Zero-Inflated Probabilistic PCA (ZIPPCA) model.
- Model Assumption: The observed count of a taxon in a sample is generated from a Zero-Inflated Negative Binomial (ZINB) model.
- Model Components:
- The Negative Binomial component models the count data and accounts for over-dispersion.
- The point mass at zero distinguishes between technical and biological zeros.
- Sample-specific effects are included in the model to correct for unequal sequencing depth.
- A low-rank representation (via latent factors) accounts for data redundancy and correlations between microbes.
- Procedure: The method uses variational approximation to learn the latent structure of the data.
- Output: The true abundance levels are recovered using the posterior mean, which borrows information across samples and taxa.
Experimental Workflow for Zero Analysis
The diagram below illustrates a logical workflow for analyzing zero-inflated microbiome data, integrating multiple concepts from the troubleshooting guides.
Statistical Methods for Handling Zero-Inflation
Table 1: Comparison of selected statistical methods and models for zero-inflated microbiome data.
| Method / Model | Brief Description | Key Application / Strength |
|---|---|---|
| ISCAZIM [14] | An integrated framework that benchmarks and selects correlation methods based on data characteristics like zero-inflation rates. | Microbiome-metabolome association analysis. |
| DESeq2-ZINBWaVE [12] | A weighted version of DESeq2 that uses ZINBWaVE-derived weights to handle zero-inflation. | General differential abundance testing with zero-inflated counts. |
| GZIGPFA [10] | GLM-based zero-inflated generalized Poisson factor analysis for high-dimensional data. | Dimensionality reduction and analysis of over-dispersed, zero-inflated counts. |
| mbDenoise [9] | A denoising method based on a Zero-Inflated Probabilistic PCA (ZIPPCA) model. | Recovering true abundance by distinguishing technical vs. biological zeros. |
| ZINB Model [8] | A two-part model combining a negative binomial count model with a point mass at zero. | Modeling counts with zero-inflation and over-dispersion. |
| DeepInsight (Modified) [15] | Converts compositional data to images on a hypersphere for analysis with CNNs. | Handling high-dimensional, zero-inflated compositional data. |
Research Reagent Solutions
Table 2: Key computational tools and resources for analyzing zero-inflated microbiome data.
| Item / Software | Function in Analysis |
|---|---|
| R Package 'pscl' [16] | Provides functions for fitting zero-inflated Poisson (ZIP) and zero-inflated negative binomial (ZINB) regression models. |
| R Package 'ZINBWaVE' [12] [8] | Generates observation weights for zero-inflated counts, which can be used by tools like DESeq2 and edgeR. |
| R Package 'Zcompositions' [15] | Implements Bayesian-multiplicative replacement methods for handling zeros in compositional data (e.g., cmultRepl function). |
| DESeq2 [12] [13] | A popular method for differential abundance analysis that uses a negative binomial model and can handle group-wise structured zeros with its penalized likelihood. |
| ALDEx2 [13] | A compositional data analysis tool that uses a centered log-ratio (CLR) transformation, often producing robust and consistent results. |
| ANCOM-II [13] | A compositional method that uses an additive log-ratio transformation to identify differentially abundant taxa. |
| mbDenoise [9] | A specialized R package for denoising microbiome data using a ZIPPCA model to recover true biological abundance. |
FAQ: Troubleshooting Overdispersion in Microbiome Data
Q1: My microbiome count data has a high proportion of zeros and its variance is much larger than its mean. What is this phenomenon and why is it a problem?
This phenomenon is called overdispersion, and when combined with an excess of zero counts, it is known as zero-inflation [3]. In microbiome data, this arises because microbial counts are characterized by:
- Compositionality: The data represents relative abundances, where an increase in one taxon necessarily causes a decrease in others [17].
- High dimensionality and sparsity: The number of taxa (features) often exceeds the number of samples, leading to many zero counts [17].
- Overdispersion: The variance of the counts significantly exceeds the mean, violating the fundamental assumption of Poisson regression where mean equals variance [3].
This is problematic because standard statistical methods like Poisson regression or normal-based models will produce biased estimates and spurious results [3]. Overdispersion inflates standard errors, compromising hypothesis tests and potentially leading to incorrect biological inferences about microbial abundance and relationships [3].
Q2: How can I diagnostically confirm overdispersion and zero-inflation in my dataset?
You can confirm this through a combination of descriptive statistics and formal model comparisons.
Descriptive Checks:
- Calculate the mean and variance of your count data. If the variance is substantially larger than the mean, overdispersion is present [3].
- Examine the proportion of zeros in your data. If this proportion exceeds what is expected under a standard Poisson or Negative Binomial distribution, zero-inflation is likely [3].
Formal Model Comparison: Fit a Poisson model and a Negative Binomial model to the same data. The Negative Binomial model includes a dispersion parameter to handle variance greater than the mean. A significant improvement in model fit (e.g., a lower Akaike Information Criterion (AIC) or Bayesian Information Criterion (BIC)) for the Negative Binomial model indicates overdispersion [3]. Similarly, compare a standard Negative Binomial model to a Zero-Inflated Negative Binomial (ZINB) or Hurdle Negative Binomial (HUNB) model. A better fit for the zero-inflated or hurdle model confirms zero-inflation [3].
Table 1: Key Descriptive Statistics Indicating Overdispersion and Zero-Inflation
| Data Characteristic | Standard Model Expectation | Indicator of Problem | Common in Microbiome Data? |
|---|---|---|---|
| Variance vs. Mean | Variance ≈ Mean (Equidispersion) | Variance >> Mean (Overdispersion) | Yes, very common [3] |
| Proportion of Zeros | Predicted by Poisson/NB distribution | Excess zeros beyond model expectation | Yes, very common [17] |
| Model Fit | Poisson model fits adequately | Negative Binomial model fits significantly better | Typical [3] |
Q3: What are the main statistical models for handling overdispersed and zero-inflated count data?
The primary models are the Negative Binomial (NB) model, Zero-Inflated Models (ZIP/ZINB), and Hurdle Models (HUP/HUNB). The table below summarizes their characteristics and applications.
Table 2: Comparison of Count Regression Models for Overdispersed and Zero-Inflated Data
| Model | Core Idea | Handles Overdispersion? | Handles Zero-Inflation? | Interpretation | Best for Microbiome Data When... |
|---|---|---|---|---|---|
| Negative Binomial (NB) | Adds a dispersion parameter to Poisson; variance = μ + kμ² [3] | Yes | No | Single set of coefficients (Rate Ratios) [3] | Overdispersion is present without a need to model zero-inflation separately [18] |
| Zero-Inflated Negative Binomial (ZINB) | Mixture model: a logit model for "structural zeros" & an NB model for counts [3] | Yes | Yes | Two parts: 1) Logit for always-zero odds, 2) NB for count rates [3] | A subset of the population is not at risk for non-zero counts (e.g., sterile sites) [3] |
| Hurdle Negative Binomial (HUNB) | Two-part model: a logit for zero vs. non-zero & a truncated NB for positive counts [3] | Yes | Yes | Two parts: 1) Logit for presence/absence, 2) NB for abundance given presence [3] | The entire population is at risk, but factors influencing presence are different from abundance [3] |
Q4: When should I choose a Hurdle model over a Zero-Inflated model?
The choice is often guided by your biological hypothesis and the data-generating process.
Choose a Zero-Inflated (ZI) model if you believe zeros arise from two distinct processes: a "structural" one (e.g., a microbial taxon is genuinely absent from a specific niche) and a "sampling" one (e.g., the taxon is present but was not detected in the sample) [3]. ZI models are suitable when a sub-population is not at risk for non-zero counts.
Choose a Hurdle model if you believe all zeros are "structural" and the population is at risk for positive counts, but the probability of crossing from zero to a positive count is governed by one set of factors, while the magnitude of the positive count is governed by another [3]. This is intuitive for presence/absence and subsequent abundance modeling.
For microbiome data, where the exact process generating zeros is often unknown, it is recommended to fit both and compare model fit statistics like AIC or BIC, while also ensuring the chosen model aligns with biological plausibility [3].
Q5: What should I do if my predictors are highly correlated (multicollinearity) in addition to having overdispersed data?
Multicollinearity among predictors (e.g., correlated environmental variables or microbial taxa) can destabilize parameter estimates and inflate standard errors. To address this, regularized or penalized regression methods can be incorporated into your count models.
- Ridge Regression: This technique adds an L2 penalty term to the model's log-likelihood, which shrinks coefficients towards zero without eliminating them, stabilizing estimates in the presence of correlated predictors [19].
- Novel Hybrid Estimators: Recent research has developed specialized estimators for this purpose. For example, a new two-parameter hybrid estimator for Zero-Inflated Negative Binomial Regression Models combines the strengths of Ridge and Liu-type estimators to effectively mitigate multicollinearity [20]. Another advancement is the Ridge-Hurdle Negative Binomial model, which integrates Ridge regularization directly into the count component of a Hurdle model [19]. Simulation studies show these methods can achieve lower mean squared error (MSE) compared to standard models when multicollinearity is present [20] [19].
Q6: Do I always need a complex zero-inflated model for my microbiome data with many zeros?
Not necessarily. A standard Negative Binomial model can often provide an adequate fit, even when there are many zeros [18]. The Negative Binomial model is simpler to estimate and interpret. You can compare a standard NB model to a ZINB model using a likelihood ratio test (if the models are nested) or information criteria like AIC/BIC [18]. If the fit of the ZINB model is not significantly better, the standard NB model may be sufficient. The decision should also be based on theoretical grounds—whether it is biologically plausible that a sub-population has absolutely zero probability of a positive count [18].
The Scientist's Toolkit: Research Reagent Solutions
Table 3: Essential Statistical "Reagents" for Analyzing Overdispersed Microbiome Data
| Tool / Method | Function | Key Application in Microbiome Research |
|---|---|---|
| Negative Binomial (NB) Regression | Models overdispersed count data by adding a dispersion parameter [3] | General workhorse for differential abundance analysis when variance > mean [3] |
| Zero-Inflated NB (ZINB) Model | Models data with excess zeros from two latent classes: "structural" and "sampling" zeros [3] | Identifying taxa that are genuinely absent vs. undetected; useful when a sub-population is not at risk [3] |
| Hurdle NB (HUNB) Model | Separately models the probability of a zero vs. a positive count and the distribution of positive counts [3] | Analyzing microbial presence/absence and, conditional on presence, its abundance [3] |
| Ridge Penalization (L2) | Shrinks coefficients of correlated predictors to stabilize estimates [19] | Handling multicollinearity in models (e.g., Ridge-ZINB, Ridge-Hurdle NB) [20] [19] |
| GLM-ASCA | Integrates Generalized Linear Models with ANOVA-simultaneous component analysis [21] | Multivariate analysis of microbiome data in complex experimental designs (e.g., with factors like time, treatment) [21] |
| Model Fit Statistics (AIC/BIC) | Compares model adequacy, penalizing for complexity [3] | Objective criteria for selecting between NB, ZINB, and HUNB models [3] |
Experimental Protocol: A Workflow for Model Selection
The following diagram maps the logical workflow for diagnosing overdispersion and selecting an appropriate statistical model.
The Compositional Nature of Microbiome Data and Its Implications
Frequently Asked Questions (FAQs)
1. What does it mean that microbiome data is "compositional," and why is it a problem? Microbiome data generated by high-throughput sequencing is compositional because the total number of sequences obtained (library size) is arbitrary and fixed by the instrument. The data therefore carries only relative information, not absolute abundances. This means that an increase in the observed proportion of one microbe must be accompanied by a decrease in the observed proportions of others. Analyzing this data with standard statistical methods that assume independence between features can produce spurious correlations and misleading results [22]. The core issue is that the data resides in a simplex (all parts sum to a constant) rather than in a real Euclidean space, which violates the assumptions of many traditional statistical tests [23].
2. What are the main types of zeros in microbiome data, and why is distinguishing them important? Zeros in microbiome data are not all the same and can arise from different sources. Understanding these types is crucial for appropriate statistical handling [23]:
- Biological Zeros: The microorganism is genuinely absent from the sample at the time of collection.
- Technical Zeros (Non-biological): The microorganism is present but was not detected due to technical limitations like insufficient sequencing depth, sampling error, or PCR amplification bias [12] [24]. Ignoring these distinctions, or treating all zeros the same, can impair the performance of differential abundance tests and lead to false discoveries [23] [12].
3. How does compositionality lead to spurious correlations? Compositional data has a built-in negative correlation bias. Because all components must sum to one, an increase in one component forces the sum of all others to decrease. This creates a dependency that does not reflect true biological interactions. Furthermore, spurious correlations can appear or disappear when you subset the data, simply as an artifact of the compositional constraint. This problem was identified by Pearson over a century ago and is a critical consideration when constructing correlation networks from relative abundance data [22].
4. My data is from a longitudinal study. What additional compositional challenges should I consider? Longitudinal microbiome data adds a layer of complexity because compositions are measured at different time points, each with its own library size. These can be affected by distinct batch effects, and filtering may result in different sub-compositions at each time point. Analyzing such data requires methods that can account for both the compositional nature and the within-subject correlation across time. Ignoring this can distort the analysis of temporal trends and microbial dynamics [25] [26].
5. What is the recommended alternative to adding a pseudo-count (like +1) to handle zeros? While adding a pseudo-count is simple, it is an ad-hoc solution that can distort the data structure and is not generally recommended [23]. A more principled approach is to use log-ratio transformations, the foundation of Compositional Data Analysis (CoDA) [22] [26]. Common transformations include:
- Additive Log-ratio (ALR): Log-transforming the ratio of each taxon to a reference taxon.
- Centered Log-ratio (CLR): Log-transforming the ratio of each taxon to the geometric mean of all taxa in the sample.
These transformations map the data from the simplex to a real Euclidean space, allowing for the use of standard statistical methods. Specialized tools like
coda4microbiomeand ANCOM implement these approaches for robust analysis [23] [26].
Troubleshooting Guides
Problem 1: Inflated False Discoveries in Differential Abundance Analysis
Symptoms: Your differential abundance analysis identifies a long list of significant taxa, but the results are biologically implausible or fail to validate in follow-up experiments.
Diagnosis: This is a classic symptom of ignoring compositionality and zero-inflation. Standard tests applied to raw counts or relative abundances often mistake compositional effects for true biological signal [22] [24].
Solution:
Adopt a compositional data analysis (CoDA) framework. The following workflow, implemented in tools like coda4microbiome, is designed for this purpose [26]:
Detailed Protocol:
- Input Data: Begin with your filtered OTU or ASV count table.
- Handle Zeros: Use model-based approaches (e.g., zero-inflated models) or identify types of zeros instead of universally adding a pseudo-count [23] [12].
- Log-Ratio Transformation: Apply a centered log-ratio (CLR) transformation. For each taxon j in sample i, calculate:
CLR(X_ij) = log[ X_ij / G(X_i) ], whereG(X_i)is the geometric mean of all taxa in sample i [23] [26]. - Model Fitting: Use a penalized regression model (like elastic-net) on the matrix of all possible pairwise log-ratios. This helps in managing high dimensionality [26].
- Signature Identification: The model selection process will identify a minimal set of taxa with maximum predictive power. The result is often expressed as a balance—a weighted log-ratio between a group of taxa that are positively associated with the outcome and a group that are negatively associated [26].
- Validation: Always validate the predictive power of the identified microbial signature using cross-validation or an independent dataset.
Problem 2: Managing Group-wise Structured Zeros in Case-Control Studies
Symptoms: A taxon appears to be highly abundant in one group (e.g., healthy controls) but is completely absent (all zeros) in the other group (e.g., disease cases). Standard differential abundance tools either fail to detect this taxon or provide unstable results.
Diagnosis: This is the problem of group-wise structured zeros or perfect separation. Many models struggle with this as it can lead to infinite parameter estimates [12].
Solution: A combined testing strategy that distinguishes between taxa with group-wise zeros and those without.
Experimental Protocol:
- Pre-processing: Filter out low-prevalence taxa as a first step to reduce noise [12] [24].
- Structured Zero Identification: Partition your taxa into two sets:
- Set A (Structured Zeros): Taxa with all zeros in one group and non-zero counts in the other.
- Set B (Standard Taxa): All other taxa.
- Differential Testing:
- For Set A, the presence/absence pattern is itself a powerful biological signal. These taxa can be reported as differentially abundant based on a test of proportions (e.g., Fisher's exact test) [12].
- For Set B, apply a robust differential abundance method capable of handling zero-inflation and compositionality. The DESeq2-ZINBWaVE pipeline is a recommended choice, as it uses observation weights from a zero-inflated negative binomial model to improve power and control false discovery rates [12].
- Result Integration: Combine the significant taxa from Set A and Set B for a complete list of candidates. Always confirm findings with biological context.
Problem 3: Correcting for Batch Effects in Compositional Data
Symptoms: In a meta-analysis of multiple datasets, samples cluster strongly by batch (e.g., sequencing run, lab) rather than by the biological factor of interest.
Diagnosis: Both technical batch effects and the inherent compositionality of the data are confounding your analysis. Standard batch effect correction tools often assume a Gaussian distribution and perform poorly on sparse, over-dispersed count data [27].
Solution: Use a two-pronged approach to correct for systematic and non-systematic batch effects.
Detailed Methodology:
- Systematic Batch Effect Correction:
- Use a negative binomial regression model tailored for count data [27].
- Model the count of each OTU as a function of the batch ID (as a fixed effect) and relevant biological covariates.
- The model equation is:
log(μ_ijg) = σ_j + X_iβ_j + γ_jg + log(N_i), whereγ_jgis the mean batch effect for OTU j in batch g. - Obtain batch-corrected counts by subtracting the estimated batch effect:
log(μ_ij*) = log(μ_ijg) - γ_jg[27].
- Non-systematic Batch Effect Correction:
- For residual, sample-specific batch influences, apply composite quantile regression [27].
- This method adjusts the distribution of OTUs in each batch to match a reference batch (selected based on a test like Kruskal-Wallis), accounting for variability at the individual OTU level without assuming a specific data distribution.
Essential Research Reagent Solutions
Table 1: Key Software Tools for Analyzing Compositional Microbiome Data
| Tool Name | Primary Function | Key Feature | Reference |
|---|---|---|---|
| coda4microbiome (R package) | Microbial signature identification in cross-sectional & longitudinal studies. | Uses penalized regression on pairwise log-ratios; results expressed as interpretable balances. | [26] |
| ANCOM/ANCOM-BC | Differential abundance testing. | Robustly controls FDR by testing the null hypothesis that a taxon is not differentially abundant relative to most other taxa. | [23] [26] |
| ALDEx2 | Differential abundance analysis. | Uses a centered log-ratio transformation and Dirichlet-multinomial model to account for compositionality. | [26] |
| DESeq2-ZINBWaVE | Differential abundance testing in zero-inflated data. | Integrates ZINBWaVE-generated observation weights into DESeq2 to handle zero-inflation. | [12] |
| MMUPHin | Batch effect correction and meta-analysis. | Provides a unified pipeline for normalizing and correcting batch effects across multiple microbiome studies. | [27] |
Visualizing Analysis Workflows and Data Relationships
Microbiome Data Analysis Pathway
Comparative Analysis of Normalization and Transformation Methods
Table 2: Comparison of Common Methods to Address Compositionality and Sparsity
| Method | Principle | Advantages | Limitations | Suitability |
|---|---|---|---|---|
| Rarefaction | Subsampling to even sequencing depth. | Simple; reduces library size bias. | Discards data; can introduce its own biases; not a solution for compositionality. | [22] |
| Pseudo-Count (+1) | Adding a small constant to all counts. | Simple; enables log-transformation. | Ad-hoc; can distort relationships and create false signals, especially for low-abundance taxa. | [23] |
| Centered Log-Ratio (CLR) | Log-transform ratios to geometric mean. | Symmetric treatment of taxa; standard PCA can be used. | Geometric mean is zero if any taxon is zero (requires zero-handling). | [22] [26] |
| Additive Log-Ratio (ALR) | Log-transform ratios to a reference taxon. | Simple; reduces dimensionality. | Results depend on choice of reference taxon (must be present in all samples). | [23] |
| Geometric Mean of Pairwise Ratios (GMPR) | Size factor calculation based on pairwise ratios. | Robust normalization for zero-inflated data. | A normalization method, not a full compositional transformation. | [24] |
Frequently Asked Questions (FAQs)
1. What is the fundamental difference between 16S rRNA and shotgun metagenomic sequencing? 16S rRNA gene sequencing is a targeted approach that uses PCR to amplify and sequence specific hypervariable regions of the bacterial 16S ribosomal RNA gene, which serves as a phylogenetic marker. This method is primarily used for taxonomic identification and profiling of bacterial and archaeal communities [28] [29]. In contrast, shotgun metagenomic sequencing sequences all genomic DNA present in a sample without targeting specific genes. This provides a comprehensive view of all microorganisms (including bacteria, viruses, fungi, and archaea) and enables functional gene analysis [29] [30].
2. Which sequencing method provides higher taxonomic resolution? Shotgun metagenomics generally provides higher taxonomic resolution, potentially down to the species or even strain level, because it accesses the entire genetic content [29] [30]. While 16S rRNA sequencing typically resolves to the genus level, advances in error-correction algorithms (like DADA2) have improved its accuracy and now allow for species-level resolution for many organisms [29]. However, the actual resolution of both methods can be limited by the completeness and quality of their respective reference databases [29] [31].
3. How does the choice of sequencing method impact the detection of functional potential? Shotgun metagenomics is the direct method for assessing the functional potential of a microbial community, as it can identify genes involved in specific metabolic pathways, virulence, and antibiotic resistance [29] [32]. While 16S rRNA data alone cannot directly provide functional information, computational tools like PICRUSt can infer metabolic function from taxonomy data, though this is predictive and indirect [29].
4. What are the primary data characteristics that challenge the statistical analysis of microbiome data? Data from both 16S and shotgun sequencing are characterized by:
- Compositionality: The data conveys relative, not absolute, abundance. An increase in one taxon's reads necessarily causes a decrease in the observed reads for others [28] [32].
- Sparsity and Zero-Inflation: A large percentage (often 80-95%) of the data are zeros, arising from both true biological absence and technical limitations (e.g., low sequencing depth) [11] [12].
- Overdispersion: The variance in the data is much higher than the mean [32] [33].
- High Dimensionality: The number of features (taxa or genes) is much greater than the number of samples, leading to the "large P, small N" problem [11] [32].
Troubleshooting Guides
Issue 1: Handling Zero-Inflation and Overdispersion in Differential Abundance Analysis
Problem: Standard statistical models fail or produce false positives because the count data has an excess of zeros and high variance.
Solution: Employ models and workflows specifically designed for these characteristics.
Recommended Workflow: A combined approach can address different types of zeros.
- For general zero-inflation, use a method that incorporates observation weights, such as DESeq2-ZINBWaVE. This method helps control the false discovery rate in the presence of technical zeros [12].
- For "group-wise structured zeros" (where a taxon is absent in all samples of one group but present in another), use the standard DESeq2 with its built-in penalized likelihood estimation, which provides finite parameter estimates and stable p-values for such taxa [12].
Alternative Models: Several other models are available to handle these issues.
- Zero-Inflated Gaussian Mixed Models (ZIGMMs): A flexible model for analyzing longitudinal microbiome data (both proportions and counts) that accounts for zero-inflation, within-subject correlations, and various random effects [33].
- Zero-Inflated Negative Binomial Models (ZINB): Useful for modeling overdispersed count data with excess zeros [12].
- corncob: A count regression model that uses a beta-binomial distribution to account for overdispersion and compositionality [32].
Issue 2: Addressing the Compositional Nature of Data
Problem: Apparent correlations and differential abundance between taxa can be spurious, arising from the closed nature of the data (i.e., all counts sum to the library size).
Solution: Use compositionally aware methods or appropriate normalizations.
Compositional Data Analysis (CoDA) Methods: These methods analyze data based on log-ratios between components, which is the relevant information in compositional data [28].
Normalization Strategies: For count-based models (e.g., DESeq2, edgeR), choose normalizations that mitigate compositional effects.
Issue 3: Choosing an Appropriate Sequencing Method for a Specific Study Goal
Problem: Uncertainty about whether to use 16S rRNA or shotgun metagenomic sequencing, leading to inadequate data for the research objectives.
Solution: Systematically evaluate the project's goals, budget, and sample type. The following table and decision guide provide a structured comparison.
- Technology Comparison Table
| Feature | 16S rRNA Sequencing | Shotgun Metagenomics |
|---|---|---|
| Target | 16S rRNA gene hypervariable regions [29] | All genomic DNA in sample [29] |
| Taxonomic Resolution | Genus to species (with modern tools) [29] | Species to strain-level [29] [30] |
| Functional Profiling | Indirect inference only (e.g., PICRUSt) [29] | Direct assessment of genes and pathways [29] [32] |
| Cross-Domain Coverage | Bacteria & Archaea (Fungi via ITS) [29] | Bacteria, Archaea, Viruses, Fungi [29] [31] |
| Sensitivity to Host DNA | Low (due to targeted PCR) [29] | High (requires depletion kits for host-heavy samples) [29] |
| DNA Input Requirement | Low (as low as 10 gene copies) [29] | Higher (minimum of 1 ng) [29] |
| Recommended Sample Type | All, including low-biomass [29] | Human microbiome (e.g., feces, saliva) [29] |
| Cost per Sample | ~$80 [29] | ~$200 (Full), ~$120 (Shallow) [29] |
| Data Sparsity | High [32] [31] | Very High [32] |
| Key Limitation | Primer bias, limited resolution [34] [29] | Database dependency, host DNA interference, cost [29] [31] |
- Experimental Protocol & Decision Guide
Diagram: A decision workflow for choosing between 16S rRNA and shotgun metagenomic sequencing.
Issue 4: Managing Database-Related Biases and False Positives
Problem: Shotgun sequencing yields false positive taxonomic calls, or 16S sequencing fails to classify a significant portion of sequences.
Solution: Understand and mitigate database limitations.
For Shotgun Metagenomics:
- Problem: If a microbe in the sample does not have a closely related representative in the reference genome database, it may be missed entirely or misassigned to a "closely-related" genome, creating false positives [29].
- Action: Use the most comprehensive database available (e.g., curated databases for human gut studies like UHGG). For non-model environments, consider manually adding genomes of interest to the database if they are known [29] [31].
For 16S rRNA Sequencing:
- Problem: Primer choice can introduce bias, as no single hypervariable region can distinguish all bacterial species [34] [31].
- Action: Use well-established primer sets (e.g., targeting the V3-V4 regions) and consider using multi-step taxonomic classification pipelines (e.g., combining DADA2 with BLASTN and Kraken2 against SILVA and RefSeq databases) to increase the percentage of sequences classified to the species level [31].
The Scientist's Toolkit: Research Reagent Solutions
| Item | Function | Application Notes |
|---|---|---|
| NucleoSpin Soil Kit | DNA extraction from complex samples like soil and feces [31]. | Used in shotgun metagenomic protocols for human stool samples [31]. |
| DNeasy PowerLyzer PowerSoil Kit | DNA extraction with bead-beating for efficient lysis of microbial cells [31]. | Used in 16S rRNA sequencing protocols to minimize bias and maximize yield [31]. |
| UMD-SelectNA CE-IVD Kit | Semi-automated method for 16S rRNA PCR and Sanger sequencing. Includes human DNA depletion and DNase treatment steps [34]. | For targeted 16S Sanger sequencing in clinical diagnostics [34]. |
| Nextera XT DNA Library Prep Kit | Prepares sequencing libraries from DNA samples for Illumina platforms [34]. | Used in shotgun metagenomics library preparation [34]. |
| HostZERO Microbial DNA Kit | Depletes host DNA (e.g., human) from samples to increase microbial sequencing depth [29]. | Critical for shotgun sequencing of samples with high host DNA content (e.g., tissue, blood) [29]. |
| ZymoBIOMICS Microbial Community Standard | Defined mock microbial community with known composition. | Serves as a positive control for evaluating sequencing accuracy, pipeline performance, and false positive rates [29]. |
The Statistical Toolkit: Models for Analyzing Complex Microbiome Data
Frequently Asked Questions (FAQs)
Data Import and Phyloseq Objects
Q1: I tried reading my BIOM file using phyloseq, but it didn't work. What's wrong?
The most common cause is a mismatch between the BIOM file format version and the package's expected format. The original phyloseq support was for BIOM-format version 1 (JSON-based). However, many recent QIIME outputs now default to version 2 (HDF5-based). The solution is to ensure you are using the import_biom function from a recent phyloseq version that supports both formats via the biomformat package [35].
Q2: My phyloseq object seems broken or is causing errors in functions. How can I check it?
Common issues include missing sample data, missing taxonomy tables, or taxa that sum to zero across all samples. You can systematically check and fix your phyloseq object using the following approach [36]:
Table: Common Phyloseq Object Issues and Solutions
| Issue | Symptoms | Solution |
|---|---|---|
| NULL sample_data | Functions requiring sample variables fail | Create a sampledata dataframe with samplenames |
| NULL tax_table | Taxonomy-based operations fail | Create a 1-column taxtable matrix with taxanames |
| Zero-sum taxa | Warnings about taxa removal; statistical issues | Remove undetected taxa with phyloseq_validate(remove_undetected = TRUE) |
Normalization and Data Preprocessing
Q3: Why is normalization critical for microbiome data analysis, and what methods are available?
Microbiome data have unique characteristics including compositionality, sparsity (zero-inflation), and over-dispersion that necessitate normalization before statistical analysis. Normalization mitigates artifactual biases from variations in sample collection, library preparation, and sequencing depth [11].
Table: Categories of Normalization Methods for Microbiome Data
| Category | Examples | Best For |
|---|---|---|
| Ecology-based | Rarefying | Even sampling depth comparison |
| Traditional | Total Sum Scaling, TSS | Simple proportional data |
| RNA-seq-based | DESeq2's median-of-ratios, edgeR's TMM | Differential abundance analysis |
| Microbiome-specific | CSS, Wrench, Geometric Mean of Pairwise Ratios | Addressing compositionality and zeros |
Rarefying (subsampling to even depth) remains common but has limitations. Methods adopted from RNA-seq analysis like DESeq2's median-of-ratios are widely used for differential abundance analysis, while newer compositionally-aware methods are valuable for specific data structures [11].
Differential Abundance Analysis
Q4: How do I handle excessive zeros in my OTU table when using DESeq2?
The DESeq2 package expects count data and can error with sparse OTU tables. A recommended solution is to calculate geometric means of counts and use these for size factor estimation [37]:
This approach addresses the problem of many zeros causing errors in the default size factor estimation, which relies on a geometric mean that becomes zero when any count is zero [37].
Q5: What's the best approach for differential abundance analysis when dealing with both zero-inflation and group-wise structured zeros?
A combined approach using different methods strategically can address these challenges effectively. For complex zero scenarios [12]:
- DESeq2-ZINBWaVE: Use for general zero-inflation (weights-based approach to control false discovery rate)
- Standard DESeq2: Apply for taxa with group-wise structured zeros (perfect separation) due to its penalized likelihood framework
This combined pipeline ensures proper handling of both biological zeros (true absences) and technical zeros (undersampling artifacts) that are common in microbiome datasets [12].
Batch Effect Correction
Q6: How can I correct for batch effects in microbiome data given its unique characteristics?
Batch effects from technical variations require specialized approaches. A composite quantile regression approach combined with negative binomial regression addresses both systematic batch effects (consistent across samples) and non-systematic batch effects (varying by OTU composition) [27]:
This approach uses negative binomial regression to address consistent batch influences and composite quantile regression to adjust OTU distributions relative to a reference batch, accommodating microbiome data's high zero-inflation and over-dispersion [27].
Troubleshooting Guides
DESeq2 with Phyloseq: Common Errors and Solutions
Problem: DESeq2 fails with "every gene contains at least one zero" error
This occurs with sparse OTU tables common in microbiome data [37].
Solution Steps:
- Calculate geometric means using only positive counts
- Apply these geometric means to estimate size factors
- Proceed with DESeq2 analysis
Problem: Non-uniform p-value distributions in DESeq2 results
This indicates potential issues with dispersion estimation or model fit, which is common with small sample sizes typical in microbiome studies [38].
Solution Approaches:
- Increase biological replicates when possible
- Consider the
fitType = "local"parameter for complex datasets - Explore alternative methods like QuasiSeq for larger sample sizes (n ≥ 4) [38]
Phyloseq Object Validation and Repair
Problem: Functions fail due to incomplete phyloseq objects
Diagnosis and Repair Workflow:
This systematic validation ensures all phyloseq components are present and appropriate for analysis [36].
Experimental Protocols
Differential Abundance Analysis with DESeq2
Protocol: Comprehensive DESeq2 workflow for microbiome data [39] [12]
Materials and Reagents:
- Normalized OTU/ASV table (from QIIME2, DADA2, or similar)
- Sample metadata with experimental design
- R with phyloseq and DESeq2 packages installed
Procedure:
- Data Import and Preprocessing
- Import OTU table and sample metadata into phyloseq
- Remove samples with extremely low sequencing depth
- Filter out taxa with prevalence below 1-5% across samples
Phyloseq to DESeq2 Conversion
Sparse Data Handling (if needed)
Statistical Testing
Results Extraction and Interpretation
Troubleshooting:
- For convergence issues: Try
fitType = "local"orfitType = "mean" - For small sample sizes: Consider
test = "LRT"with reduced model - For multiple groups: Use contrasts for specific comparisons
Batch Effect Correction Protocol
Protocol: Addressing technical variability in multi-batch studies [27]
Materials:
- Multi-batch microbiome dataset
- Batch identification metadata
- Reference batch selection criteria
Procedure:
- Batch Effect Diagnosis
- Perform PCoA with batch coloring
- Calculate PERMANOVA R-squared values for batch effect
- Compute Average Silhouette Coefficients
Systematic Batch Effect Correction
Non-systematic Batch Effect Correction
- Apply composite quantile regression
- Adjust OTU distributions to reference batch
- Validate using Kruskal-Wallis test
Correction Validation
- Compare pre- and post-correction PCoA plots
- Verify biological signal preservation
- Confirm batch effect reduction via PERMANOVA
Research Reagent Solutions
Table: Essential Computational Tools for Microbiome Analysis
| Tool/Resource | Function | Application Context |
|---|---|---|
| phyloseq R package | Data integration and visualization | Unified analysis of OTU tables, sample data, taxonomy, and trees |
| DESeq2 | Differential abundance testing | Count-based analysis with negative binomial models |
| biomformat | BIOM file import | Handling both JSON and HDF5 BIOM format versions |
| ZINBWaVE | Zero-inflated negative binomial modeling | Weighting for improved FDR control in sparse data |
| MMUPHin | Batch effect correction | Addressing heterogeneity in meta-analysis |
| microViz | Phyloseq validation and extension | Diagnostic functions and visualization enhancements |
Frequently Asked Questions (FAQs)
1. What are the fundamental differences between ZINB, ZIBB, and ZIGDM models?
These models are designed to handle count data with excess zeros, but they use different underlying distributions and are suited for different data structures.
- ZINB (Zero-Inflated Negative Binomial): This is a mixture model that combines a point mass at zero with a Negative Binomial (NB) count distribution. It is a general-purpose model for overdispersed count data where the variance exceeds the mean [40] [41]. It is widely used in genomics and microbiome analysis [42] [43].
- ZIBB (Zero-Inflated Beta-Binomial): This model is specifically designed for compositional data or data arising from a binomial process where the counts are overdispersed relative to binomial variance. It is appropriate when your counts represent the number of successes out of a fixed number of trials (e.g., counts of a specific taxon out of a total read count) and exhibit extra zeros [44].
- ZIGDM (Zero-Inflated Generalized Dirichlet-Multinomial): This model extends the framework to multivariate count data that is compositional and correlated. It accounts for the fact that the abundances of different features (e.g., microbial taxa) are not independent and sum to a constant total (library size) [32] [44].
2. How do I choose the right model for my microbiome dataset?
The choice depends on the nature of your data and the research question. The following table summarizes key selection criteria.
Table 1: Model Selection Guide for Zero-Inflated Count Data
| Model | Primary Use Case | Key Data Characteristics | Advantages |
|---|---|---|---|
| ZINB | General overdispersed count data [40] [43] | - Univariate counts- Overdispersion (variance > mean)- Excess zeros | Handles overdispersion well; widely implemented and understood [41]. |
| ZIBB | Binomial/proportion data with zeros [44] | - Counts with a fixed total (e.g., 16S rRNA sequence counts)- Overdispersion beyond binomial variance- Excess zeros | Specifically models the binomial nature of sequencing data. |
| ZIGDM | Multivariate, compositional count data [32] [44] | - Multiple, correlated count responses- Compositional data (relative abundances)- Complex correlation structure between features | Captures dependencies between features; ideal for joint modeling of microbial taxa. |
A general workflow for model selection and diagnostic checks can be visualized as follows:
3. What are the common convergence issues and how can I troubleshoot them?
Model fitting, especially for complex mixtures like ZIGDM, can fail due to several reasons:
- Cause 1: Insufficient Sample Size. Complex models with many parameters require a large number of observations. With small sample sizes, the algorithm may not have enough information to converge.
- Solution: Increase sample size if possible. If not, consider a simpler model (e.g., ZINB instead of ZIGDM) or use strong regularization [40].
- Cause 2: Incorrect Model Specification. Using a ZINB or ZIGDM model on data that is not overdispersed can lead to convergence problems. Studies have shown that NB and ZINB models face substantial convergence issues when modeling equidispersed data [40].
- Solution: Always test for overdispersion before applying these models. Use a likelihood ratio test to compare a Poisson model to a negative binomial model [41].
- Cause 3: Poorly Scaled Predictors. Variables with vastly different scales (e.g., age and gene expression counts) can make the optimization landscape difficult to traverse.
- Solution: Center and scale your continuous covariates before fitting the model.
4. How should I handle the compositional nature of microbiome data in these models?
Microbiome sequencing data is inherently compositional because the total number of reads per sample (library size) is arbitrary and does not reflect absolute abundance [32] [15] [44].
- Standard Practice: Include the log of the total sequence reads (
log(T_i)) as an offset term in your model. This is a standard approach in methods likeedgeRandDESeq2and is directly implemented in negative binomial mixed models (NBMMs) [43]. The model formula looks like:log(μ_i) = log(T_i) + X_iβ + ... - Advanced Approach: Use models specifically designed for compositionality, such as ZIGDM or the BMDD (BiModal Dirichlet Distribution) framework for zero imputation, which explicitly model the multivariate correlation structure and the sum-to-one constraint [44] [45].
5. What diagnostic checks should I perform after fitting a model?
- Check for Residual Overdispersion: Even after fitting a ZINB model, check residuals to ensure overdispersion is adequately captured.
- Zero-Inflation Test: Use tests like the Vuong test to compare your zero-inflated model (e.g., ZINB) against a standard count model (e.g., NB). A significant p-value favors the zero-inflated model [41].
- Goodness-of-Fit: Compare models using information criteria like AIC (Akaike Information Criterion) or BIC (Bayesian Information Criterion). A lower value indicates a better fit, balancing model complexity and goodness-of-fit [40] [41].
Detailed Experimental Protocols
Protocol 1: Fitting a ZINB Model for Differential Abundance Analysis
This protocol outlines the steps to identify taxa whose abundances are associated with a specific host factor (e.g., disease status, diet) using a ZINB model.
1. Data Preprocessing and Normalization:
- Input: Raw OTU/ASV count table, sample metadata.
- Normalization: Account for varying sequencing depths. While the offset method is common, other popular methods include Cumulative Sum Scaling (CSS) [32] or methods from
DESeq2/edgeRlike Relative Log Expression (RLE) or Trimmed Mean of M-values (TMM) [32] [44].
2. Model Fitting:
- For each taxon, fit a ZINB model. The model has two parts:
- Count Component:
log(μ_i) = log(T_i) + β_0 + β_1*X_i + ...whereX_iis the host factor of interest. - Zero-Inflation Component:
logit(π_i) = γ_0 + γ_1*Z_i + ...whereπ_iis the probability of an excess zero. The predictorsZ_ican be the same as or different fromX_i.
- Count Component:
3. Parameter Estimation:
- Parameters are typically estimated via Maximum Likelihood Estimation (MLE). For complex models or Bayesian approaches (like BAMZINB [46]), variational approximation or Markov Chain Monte Carlo (MCMC) methods may be used [45] [46].
4. Inference and Interpretation:
- Test the null hypothesis that the coefficient for your host factor is zero (H₀: β₁ = 0). A significant β₁ indicates a change in the abundance of the taxon is associated with the host factor, conditional on the taxon being present.
- The zero-inflation component's coefficients (γ) help understand which factors drive the excess zeros.
Protocol 2: Implementing a Multivariate Analysis with ZIGDM
This protocol is for when you need to model multiple taxa simultaneously, accounting for the correlations between them.
1. Data Preparation:
- Input: A high-dimensional count table of taxa (e.g., at the genus level).
- Address Compositionality: The model inherently accounts for the compositional structure through the Dirichlet-Multinomial framework [44].
2. Model Specification:
- The ZIGDM model jointly models the multivariate count response. It incorporates:
3. Estimation:
- Fitting a full ZIGDM model is computationally intensive. Estimation often involves variational inference or Bayesian methods with carefully chosen priors to ensure stability and convergence [45] [46].
4. Output:
- The model provides estimates of the association between covariates and each taxon, while implicitly accounting for the presence and correlations of all other taxa in the model.
Research Reagent Solutions
Table 2: Essential Tools for Analyzing Zero-Inflated Microbiome Data
| Tool / Reagent | Function / Description | Application Context |
|---|---|---|
| R Statistical Software | Primary programming environment for statistical computing and graphics. | Core platform for implementing all statistical analyses [42] [32] [43]. |
ZINB Model (e.g., in pscl or glmmTMB) |
Fits Zero-Inflated Negative Binomial regression models. | Workhorse model for univariate, overdispersed count data with excess zeros [40] [41]. |
| ZIGDM / Corncob R Package | Fits models for analyzing microbiome data based on a beta-binomial or related framework, accounting for library size and compositionality. | Differential abundance analysis for individual taxa, modeling variability and compositionality [32] [44]. |
| Vuong Test | A statistical test to compare non-nested models (e.g., ZINB vs. NB). | Model diagnosis and selection to confirm that a zero-inflated model is necessary [41]. |
| DESeq2 / edgeR | Bioconductor packages for differential analysis of sequence count data. | Standard methods for RNA-Seq data that can be applied to microbiome data; use negative binomial models without zero-inflation [32]. |
| BMDD Framework | A Bayesian method for zero imputation using a BiModal Dirichlet Distribution prior. | Accurately imputing zeros in microbiome data to improve downstream analyses like differential abundance [45]. |
| American Gut Project (AGP) Data | A large public dataset of microbiome samples with extensive host metadata. | A key resource for developing and testing new statistical methods like NB factor regression [42]. |
Hurdle models are a class of statistical models specifically designed to handle data with an excess of zero values. In these models, a random variable is modeled using two distinct parts: the first part models the probability of attaining a zero value, while the second part models the probability of all non-zero values [47]. This framework is particularly valuable in microbiome research, where data frequently exhibit zero-inflation alongside other challenging characteristics like over-dispersion and compositional effects [17] [48]. The use of hurdle models is motivated by the need to account for zero counts that are not sufficiently explained by standard statistical distributions, providing a more accurate and nuanced representation of the underlying biological processes [47].
Frequently Asked Questions (FAQs)
1. What is the fundamental difference between a Hurdle Model and a Zero-Inflated Model? Both models handle excess zeros, but they conceptualize the zero values differently. A hurdle model is a two-component mixture where one component models whether the count is zero or not (using a Bernoulli distribution), and the second component models the positive counts using a truncated count distribution (e.g., Poisson or Negative Binomial). In contrast, a zero-inflated model assumes that zeros come from two distinct sources: a point mass that always generates zeros (the "structural" zeros) and the standard count distribution (e.g., Poisson) which can also generate zeros (the "sampling" zeros) [47] [49]. The hurdle model treats all zeros as originating from a single process.
2. When should I use a Hurdle Model for my microbiome data? You should consider a hurdle model when your microbiome count data (e.g, Operational Taxonomic Unit or OTU counts) exhibits a large proportion of zeros that a standard Poisson or Negative Binomial model cannot adequately fit. This is often the case when the data generation process has a "hurdle" that must be overcome for a non-zero count to be observed, such as a taxon being either present and detected or entirely absent [47] [50]. If your goal is to cluster microbiome features based on their presence/absence and abundance patterns, a Poisson Hurdle Model is particularly suitable [50].
3. Can Hurdle Models handle over-dispersed data? Yes. While the basic hurdle model can use a Poisson distribution for the count component, a Negative Binomial Hurdle Model is specifically designed to handle over-dispersion (variance greater than the mean) in the non-zero counts [51]. This is a common feature of microbiome data, making the Negative Binomial version a frequently chosen tool.
4. How do I implement a basic Hurdle Model in statistical software? The hurdle model likelihood can be implemented directly in statistical programming environments. The model can be formulated such that if the count ( yn ) is zero, it contributes ( \log(\theta) ) to the log likelihood. If ( yn ) is positive, it contributes ( \log(1-\theta) + \log(\textsf{Poisson}(y_n \mid \lambda)) - \log(1 - \textsf{PoissonCDF}(0 \mid \lambda)) ) [49]. Several R packages, such as
pscl, offer built-in functions for fitting hurdle models.5. What are the key assumptions of a Hurdle Model? The primary assumption is that all zeros are generated by a single process, modeled by the binary component. The non-zero counts are assumed to be generated from a truncated count distribution, which applies only to positive integers. The model also assumes that the two processes (generating zeros and generating positive counts) are independent [47] [49].
Troubleshooting Common Experimental Issues
| Problem | Symptom | Diagnostic Check | Solution |
|---|---|---|---|
| Model Non-Convergence | Optimization algorithms fail to converge; parameter estimates are unstable. | Check software warnings; examine traceplots of parameters during fitting. | Simplify the model (e.g., reduce covariates), use different starting values for parameters, or use a more robust optimizer. |
| Poor Model Fit | Significant residuals; the model does not capture the patterns in the observed data, especially the number of zeros or the distribution of counts. | Perform posterior predictive checks or use goodness-of-fit tests like the rootogram. | Consider a different distribution for the count component (e.g., Negative Binomial instead of Poisson) or explore a zero-inflated model as an alternative. |
| Uncertainty in Number of Clusters | In cluster analysis, the number of groups with similar microbial features is unclear. | Use the Modified Expected Strength (MES) criterion or the Integrated Complete Likelihood (ICL) criterion. | Employ a clustering algorithm that includes a method for selecting the number of clusters, such as the Poisson Hurdle Model-based method which uses MES [50]. |
Key Experimental Protocols
Protocol: Applying a Negative Binomial Hurdle Model to Microbiome Data
This protocol is adapted from methods used for batch effect correction and is applicable for modeling microbiome counts directly [27].
Objective: To model an OTU count table, accounting for excess zeros and over-dispersion.
Step-by-Step Procedure:
- Data Preparation: Let ( Y{ijg} ) represent the count for the ( j )-th OTU in the ( i )-th sample from the ( g )-th batch. Construct a covariate matrix ( Xi ) that includes biological and technical factors (e.g., disease status, age, library size).
- Model the Non-Zero Counts: Model the positive counts (( Y{ijg} \mid Y{ijg} > 0 )) using a Negative Binomial (NB) regression.
- The model is: ( \log(\mu{ijg}) = \sigmaj + Xi \betaj + \gamma{jg} + \log(Ni) ) [27].
- Here, ( \mu{ijg} ) is the expected count, ( \sigmaj ) is the OTU-specific baseline, ( \betaj ) are covariate coefficients, ( \gamma{jg} ) is the batch effect, and ( \log(N_i) ) is the offset for library size.
- The NB variance is ( \text{Var}(Y{ijg} \mid Y{ijg}>0) = \mu{ijg} + \theta{jg} \mu{ijg}^2 ), where ( \theta{jg} ) is the dispersion parameter.
- Model the Zero Hurdle: Simultaneously, model the probability of a zero value, typically using a logistic regression (Bernoulli model) with the same or a subset of the covariates.
- Parameter Estimation: Estimate the parameters (e.g., ( \betaj ), ( \theta{jg} ), and the hurdle parameters) using maximum likelihood or Bayesian methods.
- Inference: Draw conclusions based on the combined model. For example, to adjust for a batch effect, you would subtract the estimated ( \gamma{jg} ) from the linear predictor: ( \log(\mu{ij}^*) = \log(\mu{ijg}) - \gamma{jg} ) [27].
Protocol: Clustering Microbiome Features using a Poisson Hurdle Model
This protocol is used to group OTUs that behave similarly across samples [50].
Objective: To identify clusters of microbial taxa with similar presence/absence and abundance patterns.
Step-by-Step Procedure:
- Preprocessing: Organize the data into an ( n \times m ) matrix of counts, where ( n ) is the number of samples and ( m ) is the number of OTUs.
- Model-Based Clustering: Apply a model-based clustering method where the data likelihood is given by a Poisson Hurdle Model.
- Algorithm Fitting: Use the Expectation-Maximization (EM) algorithm, or a modified version employing simulated annealing, to fit the model and assign OTUs to clusters.
- Cluster Number Selection: Utilize the algorithm's built-in methods, such as the Modified Expected Strength (MES) criterion, to determine the optimal number of clusters.
- Validation: Validate the clustering results using internal validation metrics and, if possible, biological interpretation.
Workflow and Relationship Diagrams
Hurdle Model Analysis Workflow
Research Reagent Solutions
Table: Essential Tools for Hurdle Model Analysis in Microbiome Research
| Item | Function in Analysis | Example / Note |
|---|---|---|
| R Statistical Software | Primary environment for data manipulation, model fitting, and visualization. | The base R environment provides the necessary foundation for coding and package management. |
pscl R Package |
Provides functions for fitting hurdle (and zero-inflated) models for cross-sectional data. | A key tool for implementing standard hurdle models [51]. |
PHclust R Package |
A specialized package for performing model-based clustering of sparse count data using Poisson Hurdle Models. | Implements the protocol for clustering microbiome features [50]. |
Stan / rstan |
A probabilistic programming language for statistical inference. Useful for fitting complex Bayesian hurdle models. | Allows for custom model specification and robust uncertainty quantification [49]. |
| Negative Binomial Regression | The statistical foundation for modeling the over-dispersed, non-zero count component of the data. | Used to handle variance that exceeds the mean in positive counts [27] [51]. |
| EM Algorithm | A computational algorithm used for parameter estimation in models with latent variables, such as in clustering. | Central to the fitting procedure of the PHclust method [50]. |
Beta-Binomial and Dirichlet-Multinomial Models for Overdispersion
Frequently Asked Questions
1. My microbiome count data has many zeros. Will standard Beta-Binomial or Dirichlet-Multinomial (DM) models suffice? Standard Beta-Binomial (for a single taxon) or DM (for multiple taxa) models often cannot fully capture the high number of zeros in microbiome data. The excess zeros can be both structural (the taxon is truly absent) and at-risk (the taxon is present but unobserved), requiring specialized zero-inflated versions of these models for accurate analysis [52] [53].
2. What is the key difference between Zero-Inflated Beta-Binomial (ZIBB) and Zero-Inflated Dirichlet-Multinomial (ZIDM) models? The key difference is the scope of analysis. ZIBB is typically used for univariate analysis, testing one taxon at a time for association with phenotypes or covariates [54]. ZIDM is a multivariate model that analyzes all taxa simultaneously, which naturally accounts for the compositional nature of microbiome data and the correlations between taxa [52] [55] [53].
3. When fitting a ZIDM model, my model fitting is slow and the results are hard to interpret. What should I check? This is a common challenge. First, ensure that the model is correctly specified and that you are using an efficient inference algorithm. Some Bayesian implementations of ZIDM can be computationally intensive [55]. Second, consider the model's interpretability; some complex extensions of the DM model are designed for flexibility in capturing positive correlations but may require specialized knowledge to interpret the parameters governing the dependence structure [56].
4. Can these models handle complex experimental designs, such as longitudinal data or multiple interacting factors? While ZIBB and ZIDM are powerful for cross-sectional data, analyzing experiments with multiple factors (e.g., treatment, time) often requires integrating these models into broader frameworks. One approach is to use Generalized Linear Models (GLMs) with design matrix decomposition to separate and quantify the influence of different experimental factors on the microbial community [21].
Troubleshooting Guides
Problem: Poor Model Fit Indicated by Residual Diagnostics
Issue: After fitting a Beta-Binomial or DM model, diagnostic checks reveal that the model does not adequately capture the overdispersion or zero-inflation in your data.
Solution: Upgrade to a zero-inflated mixture model.
- Step 1: Assess Zero-Inflation. Test if the number of zeros in your data exceeds what is expected under a standard Beta-Binomial or DM model. This can be done using a likelihood ratio test, which has shown that a high proportion of taxa may require zero-inflation modeling [54].
- Step 2: Choose the Appropriate Model.
- For analyzing individual taxa, implement a Zero-Inflated Beta-Binomial (ZIBB) model. This is a two-part mixture model that uses a logistic component to model excess zeros and a Beta-Binomial component for the counts [54].
- For a community-level analysis that respects compositional data, implement a Zero-Inflated Dirichlet-Multinomial (ZIDM) model. This model also uses a mixture distribution to handle excess zeros and can be more flexible than the standard DM [52] [55] [53].
Problem: Inaccurate Identification of Differentially Abundant Taxa
Issue: When testing for taxa that are associated with a phenotype (e.g., disease status), you get too many false positives (Type I errors) or fail to find true associations (low power).
Solution: Employ a method that properly controls for false discoveries and leverages the mean-variance relationship.
- Step 1: Use a Constrained Overdispersion Estimate. In models like ZIBB, estimate the overdispersion parameter as a function of the mean (e.g., a polynomial relationship). This "constrained approach" borrows strength across taxa, which increases the power to detect true associations [54].
- Step 2: Account for Covariates. Ensure your model includes relevant clinical or technical covariates (e.g., age, batch effects, library size) as confounders. Both ZIBB and ZIDM frameworks allow for this adjustment [54] [52].
- Step 3: Correct for Multiple Testing. When performing univariate tests on many taxa (as with ZIBB), apply multiple testing corrections (e.g., Benjamini-Hochberg FDR control) to your p-values.
Problem: Computational Challenges or Model Non-Convergence
Issue: The model fails to converge, takes an extremely long time to run, or produces unstable parameter estimates.
Solution: Simplify the model or use more efficient algorithms.
- Step 1: Pre-filter Taxa. Remove very low-prevalence taxa (e.g., those present in less than 5% of samples) to reduce dimensionality before fitting a multivariate model like ZIDM.
- Step 2: Use Efficient Estimation Algorithms. For complex models like ZIDM, seek out implementations that use efficient Markov Chain Monte Carlo (MCMC) algorithms. Some recent methods marginalize out latent variables to improve sampling efficiency and convergence [55].
- Step 3: Consider a Two-Stage Approach. For a large number of taxa, you can first use a univariate method like ZIBB to screen for candidate associated taxa, and then model a reduced set of taxa with a more complex multivariate model.
Model Comparison and Selection
The table below summarizes key models for overdispersed and zero-inflated microbiome count data to guide your selection.
| Model Name | Data Type | Key Features | Handles Zero-Inflation? | Common Use Case | Implementation Example |
|---|---|---|---|---|---|
| Beta-Binomial (BB) [32] | Univariate Counts | Extends binomial distribution to account for overdispersion. | No | Testing differential abundance of a single taxon. | corncob R package [32] |
| Dirichlet-Multinomial (DM) [32] [56] | Multivariate Counts | Models overdispersed compositional counts; assumes negative correlations between taxa. | No | Modeling the entire microbial community jointly. | Various R packages |
| Zero-Inflated Beta-Binomial (ZIBB) [54] | Univariate Counts | Mixture model: point mass for zeros + Beta-Binomial for counts. | Yes | Differential abundance analysis for a single taxon with excess zeros. | ZIBBSeqDiscovery R package [54] |
| Zero-Inflated DM (ZIDM) [52] [55] | Multivariate Counts | Mixture model for multivariate counts; accounts for compositionality and zero-inflation. | Yes | Jointly modeling the microbial community with excess zeros. | Custom Bayesian MCMC [55] |
| Extended Flexible DM (EFDM) [56] | Multivariate Counts | Generalizes DM to allow for both positive and negative correlations between taxa. | Yes (via mixture structure) | Exploring complex co-occurrence/co-absence patterns in the microbiome. | - |
Experimental Protocol: Differential Abundance Analysis with ZIBB
This protocol outlines the steps for identifying taxa whose abundances are associated with a phenotype of interest using the ZIBB model [54].
1. Input Data Preparation:
- Count Matrix: An ( m \times n ) matrix of raw sequencing counts, where ( m ) is the number of taxa (e.g., OTUs or ASVs) and ( n ) is the number of samples.
- Phenotype Vector: A continuous or categorical vector of length ( n ) for the variable of interest (e.g., disease state, pH level).
- Covariate Matrix: An ( n \times q ) matrix of additional covariates to adjust for (e.g., patient age, sequencing batch, library size).
2. Data Preprocessing:
- Filtering: Remove taxa that are extremely rare (e.g., present in fewer than a specified percentage of samples) to reduce noise and computational load.
- Normalization: While ZIBB models counts directly, it is often good practice to include the log-transformed library size (total reads per sample) as a covariate to account for differences in sequencing depth.
3. Model Fitting: For each taxon ( i ), the model is specified as:
- The count ( y_{ij} ) for taxon ( i ) in sample ( j ) follows a Zero-Inflated Beta-Binomial distribution.
- The logistic component models the probability of an excess zero as a function of covariates.
- The Beta-Binomial component models the count (which can be zero) with a mean linked to the phenotype and covariates, and an overdispersion parameter that is estimated under a constraint based on the mean.
4. Hypothesis Testing:
- For each taxon, a Wald test is used to test the null hypothesis that the regression coefficient for the phenotype in the Beta-Binomial component is equal to zero.
- This produces a p-value for the association between the taxon and the phenotype, adjusted for covariates.
5. Results Interpretation:
- Apply a multiple testing correction (e.g., FDR control) to all p-values from the tests across taxa.
- Taxa with an FDR-adjusted p-value below a significance threshold (e.g., 0.05) are considered differentially abundant.
The workflow for this analysis is summarized in the following diagram:
The Scientist's Toolkit: Research Reagent Solutions
| Tool / Resource | Function in Analysis | Application Context |
|---|---|---|
| ZIBBSeqDiscovery R Package [54] | Provides a pipeline for differential abundance analysis using the Zero-Inflated Beta-Binomial model. | Univariate testing of taxa associations with continuous or categorical phenotypes. |
| 16S rRNA Reference Databases (e.g., SILVA, GreenGenes) [52] | Used for taxonomic classification of sequenced reads into Operational Taxonomic Units (OTUs). | Essential pre-processing step before statistical modeling to define the taxa in the count matrix. |
| DADA2 or QIIME2 Pipelines [32] | Processes raw sequencing data into amplicon sequence variants (ASVs) or OTUs and constructs the count table. | Data generation and cleaning prior to downstream statistical analysis with BB or DM models. |
| Custom Bayesian MCMC Sampler [55] | Fits complex models like ZIDM and EFDM, which are not available in standard software. | Multivariate analysis of microbiome communities with complex correlation structures and zero-inflation. |
| corncob R Package [32] | Fits Beta-Binomial regression models to test for differential abundance and variability. | Univariate analysis of individual taxa, useful when zero-inflation is not the primary concern. |
Differential Abundance (DA) analysis is a fundamental statistical task in microbiome research, aiming to identify microorganisms whose abundances change significantly between different experimental conditions, such as health versus disease states. The field lacks a single standard methodology, and researchers often adapt tools from transcriptomics, like edgeR and DESeq2, or use methods specifically designed for microbiome data, such as ANCOM and its variants [57] [32]. The choice of method is critical, as each employs different statistical models to handle the unique characteristics of microbiome data, including zero-inflation (an excess of zero counts) and overdispersion (variance greater than the mean) [32] [58]. Furthermore, microbiome data is compositional, meaning that the data conveys relative rather than absolute abundance information; an increase in one taxon's observed abundance inevitably leads to a decrease in others [13] [58]. This technical support guide provides troubleshooting and FAQs to help researchers navigate these complexities and implement robust DA analyses.
## FAQs: Core Concepts and Method Selection
1. What are the primary statistical challenges when analyzing microbiome sequencing data? Microbiome data presents several key challenges:
- Zero-Inflation: A large percentage of counts (up to 90%) can be zeros, arising either from true biological absence or technical limitations in detecting low-abundance taxa [32] [58].
- Overdispersion: The variance in count data often exceeds the mean, violating assumptions of traditional models like the Poisson distribution [32].
- Compositionality: Sequencing data provides relative, not absolute, abundance. This means that an observed increase in one taxon can be caused by a true increase in its absolute abundance or a decrease in other taxa [13] [58].
- Variable Sequencing Depth: Differences in the total number of reads per sample (library size) can confound comparisons if not properly accounted for [57] [58].
2. Should I use a method designed for RNA-seq (like edgeR or DESeq2) or a microbiome-specific method (like ANCOM)? Both approaches are common, but they have different strengths. Methods like DESeq2 and edgeR model raw counts using a negative binomial distribution and are effective at handling overdispersion [32]. However, they may not inherently account for data compositionality, which can lead to false positives [13]. Microbiome-specific methods like ANCOM and ALDEx2 use compositional data analysis (CoDa) principles, such as log-ratio transformations, to address this issue [13] [32]. Benchmarking studies suggest that no single method is best in all scenarios, and using a consensus approach based on multiple methods can lead to more robust biological interpretations [13].
3. Why do different DA methods produce vastly different results on the same dataset? It is common for different DA methods to identify different sets of significant taxa [57] [13]. This occurs because methods differ in their:
- Underlying Statistical Models (e.g., negative binomial, zero-inflated Gaussian, or rank-based non-parametric tests) [57].
- Approach to Data Compositionality [13].
- Handling of Zeros and Normalization Strategies [57] [58].
- Statistical Power and False Discovery Rate (FDR) Control [13] [58]. One study found that while 78-92% of taxa were flagged as significant by at least one method, only 5-22% were called by the majority of methods [57].
4. How does filtering out rare taxa before analysis affect my results? Filtering taxa based on a minimum prevalence (e.g., retaining only taxa present in >10% of samples) is a common practice. This can increase the concordance between different DA methods by removing noisy, low-abundance features [57] [13]. It also reduces the multiple testing burden. However, filtering must be performed independently of the test statistic to avoid introducing biases [13].
Table 1: Comparison of Common Differential Abundance Methods
| Method | Primary Approach | Key Strength(s) | Data Compositionality Handling | Reported False Discovery Rate (FDR) Characteristics |
|---|---|---|---|---|
| ANCOM-BC | Linear model with bias correction for sampling fraction | High inter-method concordance; directly addresses compositionality | Yes (via bias correction) | Good control when sensitivity analysis is used [59] |
| ALDEx2 | Bayesian Monte Carlo sampling followed by CLR transformation | Robust compositionality handling via centered log-ratios (CLR) | Yes | Tends to be conservative, with lower power [13] [58] |
| DESeq2 | Negative binomial generalized linear model | Handles overdispersion well; widely used and validated | Not inherently | Performance varies; can be influenced by data characteristics [58] |
| edgeR | Negative binomial models with data normalization | Handles overdispersion; multiple normalization options (RLE, TMM) | Not inherently | Can exhibit higher false positive rates in some benchmarks [57] [13] |
| LEfSe | Non-parametric Kruskal-Wallis test with LDA | Identifies biologically consistent biomarkers across multiple groups | Not inherently (uses relative abundance) | N/A |
| metagenomeSeq (fitZIG) | Zero-inflated Gaussian model | Explicitly models zero inflation | Not inherently | Can have high FDR [57] |
## Troubleshooting Common Errors
### ANCOM/ANCOM-BC
Q: I encountered an error: 'rank' must be a value from 'taxonomyRanks()'. How do I fix this?
A: This error occurs when the taxonomic rank names (e.g., Phylum, Genus) in your data object are not correctly labeled. Ensure your taxonomy table uses standard rank names like "Kingdom", "Phylum", "Class", "Order", "Family", "Genus", and "Species". This issue often happens when a tax_table is created from a data.frame instead of a matrix. Use the taxonomyRanks() function on your data object to check the current rank names and update them accordingly [59].
Q: Why are some of my taxa missing from the primary results of ancombc or ancombc2?
A: Taxa can be excluded for two main reasons:
- Low Prevalence: Taxa with a prevalence below the threshold set by the
prv_cutargument are excluded. - Structural Zeros: Taxa that are completely absent (zero counts) in an entire experimental group are considered to have "structural zeros." These are summarized separately in the
zero_indoutput, as the core ANCOM-BC methodology is not designed for them [59].
Q: The tool maintainers emphasize "sensitivity analysis." What is it and why is it important? A: The sensitivity analysis in ANCOM-BC is an embedded feature designed to reduce false positives. Some published critiques of ANCOM-BC's false positive rate did not utilize this feature. It is highly recommended to keep this analysis enabled (it is on by default) unless the primary focus of your study is statistical power [59].
### DESeq2
Q: I get an error during dispersion estimation: "all gene-wise dispersion estimates are within 2 orders of magnitude..." and the standard fitting fails. What should I do? A: This error suggests low variability in your dataset, which prevents DESeq2 from reliably fitting its dispersion trend curve. The error message itself provides a solution pathway [60]:
- First, ensure you have calculated size factors for normalization using
dds <- estimateSizeFactors(dds). - Then, estimate gene-wise dispersions without fitting the trend:
dds <- estimateDispersionsGeneEst(dds). - Finally, set the dispersions to these gene-wise estimates and proceed with the Wald test:
dispersions(dds) <- mcols(dds)$dispGeneEstfollowed bydds <- nbinomWaldTest(dds).
Q: DESeq2 fails to run on my microbiome data, which contains many zeros. Are there specific parameters to try? A: Yes. If the default parametric fit fails, you can attempt a more local fit [60]:
If that also fails, the fitType = "mean" can be used as a last resort. As a best practice, ensure your count matrix does not contain all integers of the same value, as this can break the estimation process.
### edgeR
Q: My edgeR analysis keeps failing in Galaxy. What are the first things I should check? A: When using edgeR in Galaxy or any other platform, focus on these inputs [61]:
- Count Files: Ensure you are using a single, merged count matrix (tabular file with samples as columns and features as rows), not individual count files.
- Sample Mapping: Verify that your sample sheet or grouping file correctly maps sample IDs to experimental conditions and that the IDs match exactly those in the count matrix.
### General Workflow
Q: How should I structure my input files for a typical DA analysis pipeline? A: Most pipelines require three key components [62]:
- Abundance Matrix: A numeric matrix (TSV/CSV) where rows are features (e.g., bacterial taxa) and columns are observations (samples).
- Sample Sheet: A metadata file (TSV/CSV) containing at least one column for sample IDs (matching the matrix) and columns describing the experimental conditions and batches.
- Contrasts File: A file (CSV, TSV, or YAML) that explicitly defines the group comparisons. A simple TSV format requires:
id: A unique identifier for the contrast.variable: The metadata column to use (e.g., "diagnosis").reference: The baseline group (e.g., "healthy").target: The comparison group (e.g., "disease") [62].
## Experimental Protocols & Workflows
### Standardized Workflow for Method Comparison and Benchmarking
To ensure robust and reproducible results, consider adopting a standardized workflow for your DA analysis. The following protocol, synthesized from benchmarking studies, helps mitigate the risk of false discoveries by not relying on a single method.
Table 2: Key Research Reagents and Computational Tools
| Item Name | Function in Analysis | Specification / Note |
|---|---|---|
| 16S rRNA Sequence Data | Primary input data for microbiome studies. | Can be clustered into OTUs or resolved into ASVs using DADA2, Mothur, or QIIME2 [32]. |
| Metagenomic Shotgun Sequencing (MSS) Data | Alternative input data with higher resolution. | Allows classification at the species level and functional profiling [32]. |
| R/Bioconductor | Primary computing environment for statistical analysis. | Essential platform for running most DA tools like DESeq2, edgeR, ANCOMBC, and metagenomeSeq [59] [32]. |
| metaSPARSim | Data simulator for benchmarking. | Gamma-multivariate hypergeometric generative model used to create synthetic datasets with known DA taxa for method validation [58]. |
| Normalization Method (e.g., TMM, CSS, CLR) | Corrects for variable sequencing depth and compositionality. | Choice is method-dependent (e.g., TMM for edgeR, CSS for metagenomeSeq, CLR for ALDEx2) [57] [32]. |
| Prevalence Filter | Removes uninformative rare taxa. | Independent filtering applied before DA testing (e.g., retain taxa in >10% of samples) [57] [13]. |
Protocol Steps:
- Data Simulation and Preparation: Use a simulator like
metaSPARSimto generate count data with a known set of differentially abundant taxa. This establishes a ground truth for validation. Parameters should be learned from real datasets to maintain realistic data characteristics [58]. - Data Pre-processing: Apply consistent pre-processing to both simulated and real data. This includes:
- Filtering: Implement an independent prevalence filter (e.g., 10%).
- No Normalization for Model-Based Methods: Do not pre-normalize data for methods with built-in normalization (e.g., DESeq2, edgeR).
- Rarefaction for Compositional Methods: If using methods like LEfSe that require relative abundance input, rarefy the data to an even sequencing depth [13].
- Method Execution: Run a diverse panel of DA methods on the processed data. The panel should include:
- Performance Assessment: Evaluate methods using a suite of metrics on the simulated data:
- False Discovery Rate (FDR): The proportion of falsely identified DA taxa.
- Recall (Sensitivity): The proportion of true DA taxa that are correctly identified.
- Precision: The proportion of identified DA taxa that are truly differential.
- Computational Burden: Time and memory requirements [58].
- Consensus Analysis on Real Data: For your real experimental data, apply the best-performing methods from the benchmarking step. A robust biological conclusion is supported when multiple, methodologically distinct methods agree on a DA signal [57] [13].
### Decision Workflow for Differential Abundance Analysis
The following diagram outlines a logical decision process for selecting and applying DA methods, helping to navigate the key considerations highlighted in the FAQs and troubleshooting sections.
Frequently Asked Questions (FAQs)
Q1: What are the primary data characteristics that make microbiome statistical analysis challenging?
Microbiome data pose several statistical challenges due to their unique characteristics [32]:
- Zero Inflation: A large proportion (often 80-95%) of the data can be zeros, which can represent either true biological absence or technical undetection [32] [12].
- Overdispersion: The variance in the data frequently exceeds the mean, which is not accounted for in standard models like the Poisson distribution [63].
- Compositionality: The data represent relative abundances rather than absolute counts, as the total number of reads per sample (library size) is fixed and varies between samples. This makes comparisons between samples difficult [32] [12].
- High Dimensionality: The number of microbial taxa (variables) is typically much larger than the number of samples [63].
Q2: How can I determine if a zero in my data is a true absence or a technical missing value?
Distinguishing between biological zeros (true absence) and technical zeros (undetected presence) is a major challenge and often requires prior biological knowledge or spike-in controls [12]. Statistically, specialized models like the Zero-Inflated Negative Binomial (ZINB) model can be used. These models treat the data as coming from a mixture distribution: one distribution generates always-zero counts (true absence) and another generates counts from a negative binomial distribution (including the possibility of zero counts) [64] [63]. The model then estimates the probability that a given zero is a "true zero."
Q3: My differential abundance analysis fails for a taxon that is present in one group but completely absent in another. What is happening and how can I address it?
This is known as the problem of perfect separation or group-wise structured zeros [12]. Standard maximum likelihood-based methods can produce infinite parameter estimates and highly inflated standard errors for such taxa, leading to a failure to detect them as significant.
Solution: Use methods that implement a penalized likelihood strategy, which provides finite parameter estimates and reliable p-values. For example, the DESeq2 tool uses a ridge-type penalty in its estimation process, which allows it to handle this specific issue effectively [12].
Q4: Which correlation method is best for linking microbiome and metabolome data given the high number of zeros?
No single correlation method performs optimally under all conditions. A recommended strategy is to use a framework that benchmarks and integrates multiple methods. The ISCAZIM framework, for instance, first evaluates methods like Pearson, Spearman, Zero-Inflated Negative Binomial (ZINB), and Maximal Information Coefficient (MIC). It then classifies the correlation pattern as linear or non-linear and applies the best-performing method based on the zero-inflation status of the data [65]. This integrated approach is more accurate than relying on any single method.
Q5: How should I handle compositionality when constructing microbial co-occurrence networks?
Ignoring compositionality can lead to spurious correlations. It is crucial to use methods specifically designed for compositional data. Recommended methods include [32]:
- SparCC: Estimates correlations from compositional data by considering the log-ratio variance.
- SPIEC-EASI: A comprehensive framework that combines data transformation with sparse inverse covariance estimation to infer microbial ecological networks, directly addressing the compositional nature of the data.
Troubleshooting Guides
Issue 1: Inflated False Discovery Rates (FDR) in Differential Abundance Analysis
Symptoms: An unexpectedly high number of significant taxa are identified, many of which may be false positives. Validation fails or results are not biologically plausible.
| Potential Cause | Diagnostic Check | Solution |
|---|---|---|
| Not accounting for zero-inflation | Check the distribution of zeros across your groups. If zero-inflation is high, standard models like negative binomial may be inadequate. | Use a zero-inflated model (e.g., ZINBWaVE-weighted DESeq2/edgeR) [12] or a two-part model like ZINQ-L [66]. |
| Presence of group-wise structured zeros | Identify taxa that are non-zero in one group but have all zeros in another. | For these specific taxa, use a method with a penalized likelihood, such as standard DESeq2 [12]. |
| Improper normalization | Check if library sizes are highly variable across samples. | Apply a robust normalization method like Cumulative Sum Scaling (CSS) [32], Trimmed Mean of M-values (TMM) [12], or the median-of-ratios method [12]. |
Issue 2: Low Power in Detecting Associations in Longitudinal Microbiome Studies
Symptoms: Known associations are not detected, or the number of significant taxa is very low despite a strong experimental effect.
| Potential Cause | Diagnostic Check | Solution |
|---|---|---|
| Ignoring within-subject correlation | Data structure involves repeated measures from the same subjects over time. Using methods designed for cross-sectional data. | Apply a longitudinal method that includes random effects. Use a zero-inflated quantile approach for longitudinal data (ZINQ-L) [66] or a generalized linear mixed model (GLMM) [32]. |
| Only testing for mean shifts | The association might exist in other parts of the abundance distribution (e.g., upper or lower quantiles). | Implement a quantile regression-based approach like ZINQ-L, which can detect heterogeneous associations beyond the mean [66]. |
| Over-aggressive filtering | A large number of low-abundance taxa were removed during pre-processing. | Re-evaluate filtering thresholds. Use principled filtering methods that consider prevalence and abundance, rather than arbitrary cut-offs [12]. |
Experimental Protocols
Protocol 1: Implementing an Integrated Differential Abundance Pipeline for Zero-Inflation and Structured Zeros
This protocol combines two tools to address both zero-inflation and the problem of group-wise structured zeros [12].
Workflow Description: The process begins with raw microbiome data undergoing standard pre-processing (filtering, normalization). The data is then split for parallel analysis. One path uses a ZINBWaVE-weighted method to handle general zero-inflation, while another path uses standard DESeq2 to specifically handle taxa with group-wise structured zeros. Results from both paths are merged, duplicates are removed, and a final list of differentially abundant taxa is generated.
Step-by-Step Procedure:
- Pre-processing: Perform standard quality control, filtering of low-prevalence taxa, and normalization (e.g., using CSS or TMM).
- Path 1 - Zero-Inflation Analysis:
- Fit a ZINBWaVE model to the entire count matrix to calculate observation-level weights that capture the uncertainty of each zero being a technical zero.
- Run
DESeq2(oredgeR/limma-voom) using these weights (DESeq2-ZINBWaVE). This down-weights zeros that are likely technical, controlling FDR.
- Path 2 - Structured Zeros Analysis:
- Identify all taxa that exhibit group-wise structured zeros (all counts in one group are zero).
- Run standard
DESeq2on just these taxa. Its internal penalized likelihood handles the perfect separation and provides valid p-values.
- Result Integration:
- Combine the significant results from Path 1 and Path 2.
- Remove any duplicate identifications. The final list is a robust set of differentially abundant taxa.
Protocol 2: Conducting Robust Microbiome-Metabolome Association Analysis using ISCAZIM
This protocol outlines the use of the ISCAZIM framework for finding reliable associations between zero-inflated microbiome data and metabolome data [65].
Workflow Description: The process starts with pre-processed microbiome and metabolome data. The ISCAZIM framework first benchmarks several correlation methods (e.g., Pearson, Spearman, ZINB, MIC) to evaluate their performance. It then classifies the underlying correlation pattern between the datasets as either linear or non-linear. Based on this classification and the zero-inflation rate, it selects and applies the most appropriate correlation method to identify significant microbiome-metabolome association pairs.
Step-by-Step Procedure:
- Data Preparation: Normalize and transform microbiome and metabolome data as required for the correlation methods to be tested.
- Method Benchmarking: The ISCAZIM framework internally tests the performance of multiple correlation methods on your dataset structure.
- Pattern Classification: The framework assesses whether the overall association pattern between the datasets is predominantly linear or non-linear.
- Method Selection and Execution:
- For a linear pattern:
- If the zero-inflation rate (ZIR) is high, apply the Zero-Inflated Negative Binomial (ZINB) model.
- If ZIR is lower, apply Spearman's rank correlation.
- For a non-linear pattern:
- If ZIR is high, apply the Maximal Information Coefficient (MIC).
- If ZIR is lower, apply Pearson's correlation.
- For a linear pattern:
- Output: A list of significant microbiome-metabolome association pairs, with improved accuracy over using a single method.
The Scientist's Toolkit: Research Reagent Solutions
| Tool / Reagent | Function | Application Example |
|---|---|---|
| DESeq2 | A method for differential analysis of count data based on a negative binomial model. | Standard differential abundance testing; particularly effective for handling group-wise structured zeros due to its use of a penalized likelihood [12]. |
| ZINBWaVE | A method that provides observation-level weights for zero-inflated count data. | Used in conjunction with DESeq2, edgeR, or limma-voom to improve their performance on zero-inflated microbiome data (referred to as DESeq2-ZINBWaVE) [12]. |
| ZINQ-L | A zero-inflated quantile regression model for longitudinal data. | Detecting differentially abundant taxa in longitudinal studies, capable of identifying associations beyond simple mean shifts [66]. |
| ISCAZIM | An integrated statistical framework for correlation analysis of zero-inflated microbiome data. | Identifying robust associations between microbiome features (e.g., taxa) and metabolomic profiles [65]. |
| SPIEC-EASI | A network inference method designed for compositional data. | Constructing microbial co-occurrence networks from 16S rRNA or metagenomic sequencing data while accounting for compositionality [32]. |
| ANCOM-BC | A differential abundance method that accounts for compositionality and false discovery rates. | Detecting differentially abundant taxa between groups in cross-sectional studies [67] [32]. |
| MicrobiomeAnalyst | A web-based platform for comprehensive statistical, functional, and visual analysis of microbiome data. | Performing a wide range of analyses, from diversity analysis to biomarker discovery (LEfSe, Random Forest), without requiring advanced programming skills [68]. |
From Raw Data to Robust Insights: Preprocessing and Model Selection Strategies
FAQs on Microbiome Data Preprocessing
Q1: Why do standard batch effect correction methods, like ComBat, often fail for microbiome data?
Standard methods assume data is continuous and normally distributed. Microbiome data, however, consists of zero-inflated and over-dispersed counts, violating these core assumptions. Applying methods designed for Gaussian data can lead to inaccurate corrections and spurious findings. Specialized tools are required to handle its complex structure [69] [70].
Q2: How does zero-inflation specifically impact association testing between microbes and clinical variables?
Zero-inflation can impair the confidence of association analyses. The excess zeros, stemming from both true absences and undersampling, can obscure true signals and lead to biased parameter estimates if modeled with traditional statistical tests that assume a standard count distribution [14] [3].
Q3: What is the practical difference between a Zero-Inflated Negative Binomial (ZINB) and a Hurdle model?
Both models handle zero-inflation, but they conceptualize the zeros differently.
- ZINB Model: Assumes zeros come from two latent groups: a "structural" group (always zero) and a "sampling" group (at risk for a count, but zero was observed).
- Hurdle Model: Assumes all zeros are "structural" and models the data in two parts: one process for the binary outcome of zero vs. non-zero, and a separate process for the positive counts. The choice depends on your research question and assumptions about the data-generating process [3].
Q4: My dataset combines samples from multiple studies with different sequencing protocols. What is a robust approach to correct for these major batch effects?
A conditional quantile regression (ConQuR) approach is designed for this challenge. It non-parametrically models the complex distribution of microbiome counts and removes batch effects relative to a chosen reference batch. This method is robust to high levels of zero-inflation and over-dispersion, making it suitable for integrating heterogeneous studies [69] [70].
Table 1: Common normalization techniques for microbiome data.
| Method | Brief Description | Key Consideration |
|---|---|---|
| Total-Sum Scaling (TSS) | Converts counts to relative abundances by dividing by the total reads per sample. | Simple, but fails to address compositionality; sensitive to sampling depth. |
| Centered Log-Ratio (CLR) | Applies a log-transformation to relative abundances, centered by the geometric mean of the sample. | Addresses compositionality; requires dealing with zeros before application. |
Table 2: Selected batch effect correction algorithms tailored for microbiome data.
| Tool / Method | Underlying Approach | Key Strength | Citation |
|---|---|---|---|
| ConQuR | Conditional two-part quantile regression | Non-parametric; corrects entire conditional distribution, including zeros. | [69] |
| MBECS | Integrated suite of multiple algorithms (e.g., ComBat, RUV, PN) | Provides a unified workflow to compare and evaluate several correction methods. | [71] |
| Percentile Normalization | Aligns the empirical distribution of each batch to a reference. | Mitigates over-dispersion and zero-inflation impact. | [71] |
Experimental Protocol: Batch Effect Correction with ConQuR
Objective: To remove batch effects from a microbiome count table while preserving biological signals of interest.
Materials:
- A taxon count table (OTU or ASV table) from multiple batches.
- Metadata including batch IDs and key biological variables/covariates.
Methodology:
- Data Preparation: Organize your count data and metadata. It is recommended to filter out extremely low-abundance taxa to reduce noise.
- Reference Batch Selection: Choose one batch as a reference. This batch should be of high quality and representative of your study.
- Model Fitting (Regression Step): For each taxon, a two-part model is fitted:
- Logistic Model: Regresses the probability of the taxon's presence against batch ID, key variables, and covariates.
- Quantile Regression Model: Models multiple percentiles (e.g., median, quartiles) of the taxon's non-zero abundance against the same set of variables.
- Effect Removal: The estimated batch effects are subtracted from both the logistic and quantile parts of the model relative to the reference batch.
- Count Matching (Matching Step): For each original count value, its percentile in the estimated original distribution is found. The corrected value is the count at that same percentile in the estimated batch-free distribution.
- Output: The result is a batch-corrected count table that can be used for downstream analyses like ordination, clustering, or association testing [69].
Workflow Visualization
Diagram 1: Core Preprocessing Workflow. This flowchart outlines the essential steps for preparing microbiome data, highlighting the decision point for choosing a batch effect correction strategy.
Diagram 2: ConQuR's Two-Part Model. This diagram details the two-part conditional quantile regression process used by ConQuR to correct for batch effects in zero-inflated count data [69].
The Scientist's Toolkit: Essential Research Reagent Solutions
Table 3: Key statistical models and software suites for analyzing zero-inflated microbiome data.
| Tool / Model | Function | Key Feature |
|---|---|---|
| ZINB / ZIGP Regression | Models over-dispersed, zero-inflated counts for differential abundance. | Accounts for two sources of zeros; ZIGP can offer more flexibility than ZINB in some cases [72] [3] [63]. |
| ISCAZIM Framework | Integrated statistical correlation analysis for microbiome-metabolome studies. | Automatically selects the best correlation method based on data characteristics like zero-inflation rate [14]. |
| MBECS R Package | A comprehensive suite for batch effect correction and evaluation. | Integrates multiple correction algorithms and provides standardized metrics to evaluate their performance [71]. |
| GLM-ASCA | Combines Generalized Linear Models with ANOVA-simultaneous component analysis. | Integrates experimental design into a multivariate framework to model complex data and separate factor effects [21]. |
This technical support center provides troubleshooting guides and FAQs to help researchers address common challenges encountered during the analysis of microbiome sequencing data.
Frequently Asked Questions (FAQs)
FAQ 1: Why is normalization a critical step before conducting differential abundance analysis on microbiome data?
Microbiome sequencing data are inherently compositional, meaning the counts for each sample sum to a library size that is arbitrary and determined by sequencing depth. Without normalization, this compositionality can introduce severe biases, making it appear that the relative abundance of one taxon increases simply because another decreases [11] [73]. Furthermore, data is affected by various sources of systematic variability, including differences in DNA extraction, library preparation, and sequencing depth. Normalization aims to mitigate these technical artifacts, ensuring that observed differences in downstream analyses reflect true biological variation rather than technical noise [74].
FAQ 2: My microbiome data has a large number of zeros. How does this affect my choice of normalization method?
Zero-inflation is a key characteristic of microbiome data [11]. Many standard normalization methods, such as RLE (Relative Log Expression), can be sensitive to high zero counts because they rely on geometric means or log-fold changes, which are undefined for zeros [75]. For zero-inflated data, consider methods specifically designed for this challenge:
- GMPR (Geometric Mean of Pairwise Ratios): Reverses the steps in RLE to first calculate the median count ratio of non-zero counts between samples, making it more robust to zeros [75].
- CSS (Cumulative Sum Scaling): Calculates the scaling factor as the cumulative sum of counts up to a data-driven threshold, which can help minimize the impact of rare, zero-inflated features [76] [74].
- Methods incorporating zero-inflated models: Statistical approaches like ZIBSeq (Zero-Inflated Beta Regression) or ZINQ-L (Zero-Inflated Quantile-Longitudinal) explicitly model the data using a mixture distribution that accounts for the excess zeros [76] [66].
FAQ 3: For longitudinal microbiome studies, are standard normalization methods like TMM or RLE still appropriate?
Standard normalization methods are designed for cross-sectional studies and do not account for the time-dependent correlation structure in longitudinal data [75]. Using them on time-series data may lead to suboptimal results. A method like TimeNorm has been specifically developed for this context. It performs two types of normalization: "Intra-time" normalization, which standardizes samples within the same time point, and "Bridge" normalization, which leverages stable features across adjacent time points to standardize samples over time [75].
FAQ 4: I am using shotgun metagenomic data. Can I use normalization methods developed for 16S rRNA data?
Yes, many normalization methods are applied to both 16S rRNA and shotgun metagenomic data. In fact, specifically designed methods for shotgun data are rare, and researchers often adopt methods from other fields like RNA-seq [11]. Methods such as TMM and RLE have been systematically evaluated on shotgun metagenomic gene abundance data and have shown high performance in terms of true positive rates and false discovery rate control [74]. Therefore, they are generally considered suitable and effective choices.
Troubleshooting Guide: Common Normalization Issues and Solutions
| Problem Scenario | Symptoms in Downstream Analysis | Recommended Solution | Principle |
|---|---|---|---|
| High False Positives in DAA | Many taxa are identified as differentially abundant, but results lack biological plausibility or are not reproducible. | Switch to a more robust scaling method like TMM or RLE [74]. | These methods use robust statistics (trimmed mean, median) that are less influenced by highly variable or abundant taxa that can distort total-sum scaling factors. |
| Poor Cross-Study Prediction | A model trained on one dataset performs poorly when applied to another dataset from a different population or study. | Apply batch correction methods (e.g., BMC, Limma) or transformation methods that achieve normality (e.g., Blom, NPN) [77]. | This addresses population-level heterogeneity and batch effects that simple scaling cannot remove, aligning the data distributions across different cohorts. |
| Presence of Group-Wise Structured Zeros | A taxon is absent (all zeros) in all samples of one experimental group but present in another, causing statistical models to fail. | Use a method with a penalized likelihood approach, such as DESeq2, which can provide finite parameter estimates for such taxa [12]. | Penalization handles the perfect separation problem, allowing for inference on taxa that would otherwise be dropped or produce infinite estimates. |
| Low Power in Longitudinal DAA | Inability to detect taxa with dynamic temporal abundance patterns between conditions. | Employ a longitudinal-specific method like ZINQ-L [66] or a normalization method like TimeNorm [75] prior to analysis with a cross-sectional tool. | These methods explicitly model within-subject correlations over time or normalize data in a time-aware manner, increasing the power to detect true longitudinal signals. |
Performance Comparison of Key Normalization Methods
The table below summarizes the performance of commonly used normalization methods based on comprehensive benchmarking studies.
Table 1: Evaluation of Normalization Methods for Microbiome Data
| Method | Core Principle | Best For / Strengths | Key Performance Findings |
|---|---|---|---|
| TMM (Trimmed Mean of M-values) | Weighted trimmed mean of log-fold changes relative to a reference sample. | Shotgun metagenomic data; Situations with asymmetric differential abundance [74]. | Achieves high true positive rate (TPR) and controls false discovery rate (FDR) well, especially with asymmetric signals [74]. Shows consistent performance in cross-study prediction [77]. |
| RLE (Relative Log Expression) | Median of log-ratios relative to a pseudo-sample (geometric mean). | General-purpose use with RNA-seq and metagenomic data. | Along with TMM, shows high overall performance for identifying differentially abundant genes in shotgun data [74]. Performance can drop with high zero inflation. |
| CSS (Cumulative Sum Scaling) | Cumulative sum of counts up to a data-driven percentile. | Managing variable high-abundant genes; Used in the metagenomeSeq package. |
Shows satisfactory performance with larger sample sizes [74]. The normalization factor is robust to outliers. |
| TSS (Total Sum Scaling) | Converts counts to proportions by dividing by the total library size. | Simple and intuitive transformation. | Not robust to outliers; performance in prediction declines rapidly with population heterogeneity [77]. Can introduce compositionality bias. |
| GMPR (Geometric Mean of Pairwise Ratios) | Geometric mean of pairwise ratios based on non-zero counts. | Zero-inflated microbiome datasets [75]. | More robust to zero-inflation than RLE, improving normalization accuracy when many features are sparse. |
| Group-Wise Methods (e.g., G-RLE, FTSS) | Calculates normalization factors using group-level summary statistics. | Challenging scenarios with large compositional bias or high variance between groups [73]. | Emerging methods designed to improve FDR control and power by reducing bias in differential abundance analysis [73]. |
Experimental Protocols for Key Normalization Methods
Protocol 1: Implementing TMM Normalization with edgeR
TMM normalization is widely used to correct for compositionality and differing library sizes. This protocol is adapted for microbiome count data (OTU/ASV table).
Research Reagent Solutions:
- Software Environment: R statistical software
- R Package:
edgeR[74] - Input Data: A taxa (rows) x samples (columns) count matrix.
Methodology:
- Data Input: Load your count matrix into R. Ensure that the data is in a format that can be converted into a
DGEListobject, the standard data structure inedgeR. - Create DGEList Object: Use the
DGEList()function to create an object containing the counts and, optionally, sample grouping information. - Calculate Normalization Factors: Apply the
calcNormFactors()function to theDGEListobject. Specify the method as "TMM" (this is often the default). - Access Results: The normalization factors for each sample are stored in
y$samples$norm.factors. These factors are automatically used in downstream differential abundance testing procedures withinedgeR.
Protocol 2: Applying CSS Normalization with metagenomeSeq
CSS is part of the metagenomeSeq package and is designed to handle the sparsity and compositionality of microbiome data.
Research Reagent Solutions:
- Software Environment: R statistical software
- R Package:
metagenomeSeq[76] - Input Data: A taxa (rows) x samples (columns) count matrix.
Methodology:
- Data Input and Object Creation: Load your count data and create an
MRexperimentobject using thenewMRexperiment()function. - Calculate Cumulative Sums: The
cumNorm()function is used to calculate the cumulative sum distributions for each sample. - Determine Normalization Percentile: The
cumNormStat()function can be employed to automatically determine the threshold percentile used for scaling. This is done by finding the point where the cumulative sum distribution crosses a reference line. - Access Normalized Counts: Use the
MRcounts()function with the argumentnorm=TRUEto retrieve the CSS-normalized counts for downstream analysis.
Workflow Visualization
The following diagram illustrates a logical decision pathway for selecting an appropriate normalization method based on the characteristics of your dataset and research question.
Diagram 1: A decision workflow for selecting microbiome normalization methods.
Frequently Asked Questions
1. What is the Akaike Information Criterion (AIC) and how do I interpret it? The Akaike Information Criterion (AIC) is a mathematical method used to compare different possible statistical models and determine which one is the best fit for your data [78] [79]. It balances the model's goodness of fit with its complexity, penalizing models that use more parameters to avoid overfitting [79]. The formula is AIC = 2K - 2ln(L), where K is the number of parameters in the model and L is the maximum value of the likelihood function for the model [79]. When comparing models, the one with the lowest AIC score is considered the best [78]. As a rule of thumb, a difference in AIC (ΔAIC) of more than 2 points is considered significant evidence that the model with the lower AIC is preferable [78].
2. How do I choose between a zero-inflated model and a hurdle model for my microbiome data? Both zero-inflated (ZI) and hurdle models are two-part mixtures designed to handle count data with an excess of zero observations, common in microbiome analyses [80]. The critical difference lies in how they treat zero counts:
- Zero-Inflated Models assume zeros come from two origins: "structural zeros" (the entity is truly absent) and "sampling zeros" (the entity is present but undetected by the sampling process) [80].
- Hurdle Models treat all zeros as originating from a single process, modeling a zero mass separately from the positive counts, which follow a truncated count distribution (e.g., truncated Poisson or Negative Binomial) [80].
The final choice should be made after a careful assessment of goodness-of-fit statistics like AIC and by examining residuals, as there is no one-size-fits-all answer [80].
3. Can I use Vuong's test to compare a zero-inflated model to its non-zero-inflated counterpart? No, this is an improper use of Vuong's test. Vuong's test is designed for comparing non-nested models [81] [82]. A non-zero-inflated model (e.g., a standard Poisson or Negative Binomial) is neither strictly non-nested nor partially non-nested in its zero-inflated counterpart (e.g., ZIP or ZINB) [81]. Using Vuong's test for this purpose is invalid, and other model selection criteria, such as AIC, should be used instead [81].
4. What are the key considerations for model selection in microbiome data analysis? Microbiome data is characterized by zero-inflation, overdispersion, and multivariate structure [83] [65] [46]. When selecting a model:
- Account for Zero Inflation: Use models like ZINB or Hurdle NB to avoid biased estimates [80] [83].
- Account for Overdispersion: The Negative Binomial (NB) distribution is often more appropriate than Poisson as it has a dispersion parameter to model extra variance [80] [83].
- Assess Model Fit: Use criteria like AIC to compare models and diagnostic tools like Randomized Quantile Residuals (RQR) to check if the model is correctly specified [80].
Troubleshooting Guides
Problem: My model fails to account for overdispersion, leading to biased standard errors.
Solution:
- Diagnose: Check if the variance of your count data is significantly larger than the mean. If so, your data is overdispersed.
- Switch Distributions: Move from a Poisson-based model to a Negative Binomial (NB)-based model [80] [83]. The ZINB and Hurdle NB models explicitly include a dispersion parameter to handle this [80].
- Implement in R: Instead of using
zeroinfl()from thepsclpackage for a ZIP model, you can use it to fit a ZINB by specifying thedist = "negbin"argument. Alternatively, theglmmTMBpackage can fit ZINB and Hurdle NB models.
Problem: I am unsure whether my data has structural zeros, making the choice between ZI and Hurdle models difficult.
Solution:
- Theoretical Grounding: Consider the biological or experimental context. Are some zeros expected to be "true" absences (structural zeros)? For example, in microbiome studies, a taxon may be absent in one body site but present in another [80] [83].
- Fit Both Models: Fit both the ZI and Hurdle models to your data.
- Compare Goodness-of-Fit: Use AIC to compare them. The model with the substantially lower AIC is generally preferred [80] [78].
- Inspect Residuals: Use tools like Randomized Quantile Residuals (RQR). If the model is correctly specified, the RQRs should be approximately normally distributed and their plot against predicted values should show no discernible pattern [80].
Problem: I need to compare two non-nested models (e.g., with different functional forms) for my data.
Solution: Use Vuong's Closeness Test. This likelihood-ratio-based test determines which of two non-nested models is closer to the true data-generating process [81] [82].
- Hypotheses:
- H₀: Both models are equally close to the true process.
- H₁: One model is closer.
- Test Statistic: The Vuong statistic V asymptotically follows a standard normal distribution under H₀ [81] [82].
- Decision Rule:
- If |V| > 1.96 (at α=0.05), reject H₀.
- If V > 1.96, prefer Model A.
- If V < -1.96, prefer Model B.
- Procedure in R:
- Fit both models (Model A and Model B) via Maximum Likelihood.
- Use the
vuong()function from thepsclpackage to perform the test. - For models with different numbers of parameters, use the penalized version of the test to account for complexity [82].
Model Selection Criteria at a Glance
The table below summarizes the primary tools for model selection.
| Method | Primary Use | Interpretation | Key Considerations |
|---|---|---|---|
| Akaike Information Criterion (AIC) [78] [79] | Comparing multiple nested or non-nested models. | Lower AIC indicates a better fit. A ΔAIC > 2 is significant. | Penalizes model complexity; useful for model selection but not hypothesis testing. |
| Vuong's Test [81] [82] | Comparing two non-nested models. | Significant positive V favors Model A; negative V favors Model B. | Requires models to be fit via MLE. Invalid for comparing zero-inflated to non-zero-inflated models [81]. |
| Bayes Factors | Comparing Bayesian models based on marginal likelihood. | BF₁₂ > 1 supports Model 1 over Model 2. Values > 3, 10, 100 provide increasing evidence. | Computationally intensive. Provides a direct probability of one model over another. |
Experimental Protocol: Model Selection Workflow for Microbiome Data
This protocol outlines a step-by-step process for selecting an appropriate count model for zero-inflated microbiome data.
1. Objective: To identify the best statistical model for analyzing microbiome (OTU) count data that exhibits zero-inflation and overdispersion.
2. Materials/Software:
- R Statistical Software: The primary computing environment.
- R Packages:
pscl: For fitting Zero-Inflated and Hurdle models (Poisson and NB) and performing Vuong's test.glmmTMB: For fitting a wider range of generalized linear mixed models, including ZINB and Hurdle NB.AICcmodavg: For easily comparing AIC values of multiple models.
3. Procedure:
- Data Exploration and Visualization: Examine the distribution of counts. Calculate the mean and variance of your OTUs to identify overdispersion. Plot the histogram of counts to visualize zero-inflation.
- Fit a Suite of Candidate Models: Fit the following models to your data:
- Standard Poisson (for baseline comparison)
- Negative Binomial (NB)
- Zero-Inflated Poisson (ZIP)
- Zero-Inflated Negative Binomial (ZINB)
- Hurdle Poisson
- Hurdle Negative Binomial
- Calculate Goodness-of-Fit Statistics: Extract the AIC value for each model fitted in Step 2.
- Perform Model Comparison: Rank all models by their AIC values. The model with the smallest AIC is the best among the candidates. Consider models with ΔAIC < 2 to have substantial support.
- Diagnostic Checking (Critical Step): For the top-performing model(s), perform diagnostic checks using Randomized Quantile Residuals (RQR). If the model is correct, the RQRs should be approximately normally distributed [80].
- Final Model Selection: Choose the model with the best (lowest) AIC that also passes the diagnostic checks and makes sense within your research context.
Workflow Diagram: Model Selection Logic
The following diagram visualizes the logical decision process for selecting a count model.
This table lists key statistical "reagents" and computational tools essential for model selection in the analysis of zero-inflated microbiome data.
| Item / Reagent | Function / Application | Specifications / Notes |
|---|---|---|
| Akaike Information Criterion (AIC) | A model comparison metric that rewards goodness-of-fit while penalizing for the number of parameters, helping to prevent overfitting [78] [79]. | Calculated as AIC = 2K - 2ln(L). The preferred model is the one with the minimum AIC value. |
| Vuong's Closeness Test | A statistical test to compare two non-nested models fitted by Maximum Likelihood Estimation (MLE) [81] [82]. | Warning: Its use is invalid for comparing a zero-inflated model to its non-inflated counterpart (e.g., ZIP vs. Poisson) [81]. |
| Zero-Inflated Negative Binomial (ZINB) Model | A count model that handles both zero-inflation (structural and sampling zeros) and overdispersion, making it highly suitable for microbiome data [80] [83]. | Implemented in R using zeroinfl(..., dist = "negbin") from the pscl package or the glmmTMB package. |
| Randomized Quantile Residuals (RQR) | A type of residual used to diagnose the fit of discrete outcome models. If the model is correct, RQRs should be approximately normally distributed [80]. | Superior to Pearson or deviance residuals for models on a discrete scale, such as count models. |
| R Statistical Software | The primary computational environment for statistical analysis and modeling. | Essential packages include pscl, glmmTMB, AICcmodavg, and AER (for dispersion tests). |
Addressing Taxonomic Misclassification and Its Impact on Inference
Core Concepts: Misclassification, Zero-Inflation, and Overdispersion
Taxonomic misclassification occurs when microbial sequences are incorrectly assigned to taxonomic groups during bioinformatics analysis. This problem arises because sequences are often not a 100% match with any sequence in reference databases, leading to incorrect assessment of diversity and abundance [84]. Meanwhile, zero-inflation refers to the excess zero counts in microbiome data from either truly absent taxa (structural zeros) or undetected present taxa (at-risk zeros). Overdispersion describes the high variability in microbial counts where variance exceeds the mean [52] [85].
These three challenges are interconnected: misclassification can create artificial zeros or inflate counts for wrong taxa, exacerbating zero-inflation and overdispersion. Ignoring these issues during analysis leads to biased inference, underestimated parameter uncertainty, and reduced reproducibility in microbiome studies [52].
Frequently Asked Questions
Table 1: Common Experimental Issues and Solutions
| Problem | Root Cause | Solution | Prevention Tips |
|---|---|---|---|
| Too many zeros in count data | True absence, low abundance, or misclassification [52]. | Apply Zero-Inflated Dirichlet-Multinomial (ZIDM) models [52]. | Optimize sequencing depth; use validated DNA extraction kits. |
| High variability between replicates | Natural biological variation & technical noise (Overdispersion) [85]. | Use Dirichlet-Multinomial or Negative Binomial models instead of Poisson [52] [85]. | Standardize sample collection and processing protocols. |
| Inconsistent taxonomy across tools | Different algorithms & reference databases [86] [87]. | Use a standardized pipeline (e.g., ATLAS, IDTAXA) and maintain database versions [86] [87]. | Use a single, well-curated database (e.g., SILVA, GreenGenes). |
| Low-resolution taxonomic assignments | Conservative "most recent common ancestor" (MRCA) strategies [86]. | Apply ATLAS to identify sub-genus partitions [86]. | Use classifiers with higher resolution (e.g., IDTAXA) [87]. |
Table 2: Statistical Model Selection Guide
| Model | Best For | Handles Zero-Inflation? | Handles Overdispersion? | Handles Compositionality? |
|---|---|---|---|---|
| Dirichlet-Multinomial (DM) [52] | Multivariate count data, relative abundances. | No | Yes | Yes |
| Zero-Inflated DM (ZIDM) [52] | Multivariate data with excess zeros. | Yes | Yes | Yes |
| Negative Binomial (NB) [88] | Univariate overdispersed counts. | No | Yes | No |
| Zero-Inflated NB (ZINB) [88] | Univariate counts with both issues. | Yes | Yes | No |
Troubleshooting Guides
Problem: Results Not Reproducible Across Studies
Symptoms: Significant findings disappear when using different classification databases or parameters.
Diagnosis: High sensitivity to taxonomic misclassification.
Solution: Propagate classification uncertainty through the analysis.
- Algorithm: Use the ATLAS pipeline, which groups sequences into "partitions" based on BLAST hits and a confusion graph, capturing assignment ambiguity [86].
- Workflow:
- Input: Query sequences and a reference database.
- BLAST & Outlier Detection: Run BLAST and use the BLAST outlier detection algorithm to identify significant hits [86].
- Build Confusion Graph: Construct a graph where nodes are database sequences connected if they co-occur as hits for a query [86].
- Generate Partitions: Identify tightly-knit clusters (partitions) in the graph, which represent groups of database sequences that are ambiguous for the query set [86].
- Output: Use these partitions for downstream analysis instead of fixed taxonomy.
Problem: Model Poor Fit Due to Excess Zeros and Outliers
Symptoms: Standard models (e.g., ZINB) fit the bulk data but fail in the tail regions where outliers reside [88].
Diagnosis: Data has heavy-tailed distribution alongside zero-inflation.
Solution: Implement a flexible, heavy-tailed model.
- Model: Zero-Inflated Discrete Extended Generalized Pareto Distribution (ZIDEGPD) [88].
- Protocol:
- Assess Fit: Compare ZINB and ZIDEGPD models using Akaike Information Criterion (AIC) and visual inspection of tail fit [88].
- Implement ZIDEGPD: If ZINB fit is poor, use ZIDEGPD which uses a tail index from the Generalized Pareto Distribution to better model outliers [88].
- Validate: Use simulation studies to confirm the model's performance relative to alternatives [88].
Experimental Protocols
Protocol 1: The MicroMiss Model for Integrated Analysis
This protocol uses a Bayesian framework to simultaneously handle zero-inflation and taxonomic misclassification [52].
MicroMiss Statistical Model Workflow
Background: The MicroMiss model treats the true, unobserved taxonomic classifications as latent variables and uses a confusion matrix to model the probability of observed classifications given the true ones [52].
Step-by-Step Procedure:
- Model True Abundance: Assume the true microbial relative abundances for sample (i), denoted (\varvec{\Theta}{i}), follow a Dirichlet distribution: (\varvec{\Theta}{i} \sim \text{Dirichlet}(\varvec{\gamma}_{i})) [52].
- Incorporate Covariates: Link covariates (\varvec{x}{i}) (e.g., disease state) to the concentration parameters: (\log(\gamma{it}) = \varvec{x}{i}^{\prime} \varvec{\beta}{\gamma_{t}}) [52].
- Model True Classification: Assume the true classification of each organism, (\varvec{z}{il}), follows a multinomial distribution given (\varvec{\Theta}{i}): (\varvec{z}{il}|\varvec{\Theta}{i} \sim \text{Multinomial}(1,\varvec{\Theta}_{i})) [52].
- Model Zero-Inflation: Differentiate between structural and at-risk zeros using a two-component mixture model [52].
- Model Observed Data: Given the true classification (\varvec{z}{il}), the observed classification (\varvec{y}{il}) follows another multinomial distribution governed by a confusion matrix that encodes misclassification probabilities [52].
- Posterior Inference: Use Bayesian methods (e.g., MCMC) to estimate model parameters and obtain corrected estimates of relative abundance and covariate effects.
Protocol 2: The ATLAS Pipeline for Ambiguity-Aware Classification
This protocol provides a computationally efficient method for capturing taxonomic ambiguity [86].
ATLAS Classification Workflow
Principle: ATLAS (Ambiguous Taxonomy eLucidation by Apportionment of Sequences) groups sequences into biologically meaningful partitions that capture the ambiguity in the assignment process, rather than forcing a single, potentially incorrect label [86].
Methodology:
- Sequence Alignment: Use BLAST to align all query sequences against a reference database. Use parameters:
-outfmt "6 qseqid sseqid pident length mismatch gapopen qstart qend sstart send evalue bitscore qseq sseq"[86]. - Identify Significant Hits: Apply the "BLAST outlier detection" algorithm to identify significant top BLAST hits for each query. This algorithm uses Bayesian integral log odds (BILD) scores to determine if the multiple alignment of top hits can be split into significantly different groups, avoiding ad-hoc cut-offs on percent identity or E-value [86].
- Construct Confusion Graph: Build a graph where nodes represent sequences in the reference database. Connect two nodes with an edge if they are both present in the "outlier set" (set of significant hits) for at least one query sequence. Weight the edges by the number of query sequences for which the two database sequences co-occur [86].
- Generate Partitions: Identify tightly-knit subcommunities (clusters) in the confusion graph. These clusters are the final "partitions"—groups of database sequences that are ambiguously related to the query set. These partitions are used for downstream differential abundance analysis, improving detection power [86].
The Scientist's Toolkit
Table 3: Essential Research Reagents and Computational Tools
| Item Name | Type | Function in Analysis | Example/Reference |
|---|---|---|---|
| IDTAXA Classifier [87] | Software Algorithm | Reduces over-classification errors by using a machine learning approach based on decision k-mers and a tree descent method. | R DECIPHER Package [87] |
| ATLAS Pipeline [86] | Software Algorithm | Groups sequences into partitions to capture taxonomic ambiguity, improving differential abundance detection. | GitHub: shahnidhi/outlierinBLAST_hits [86] |
| ZIDM Model [52] | Statistical Model | Models multivariate compositional count data with excess zeros, accounting for overdispersion. | MicroMiss Framework [52] |
| ZIDEGPD Model [88] | Statistical Model | Provides a robust fit for heavy-tailed, zero-inflated count data where ZINB fails. | Discrete Extended Generalized Pareto Model [88] |
| SILVA / GreenGenes [52] | Reference Database | Curated databases of 16S rRNA sequences used for taxonomic classification during bioinformatics. | [52] |
| BLAST [86] | Bioinformatics Tool | Finds regions of local similarity between query sequences and reference databases; used by ATLAS. | NCBI BLAST+ [86] |
| DECIPHER R Package [87] | Software Package | Contains the IDTAXA classifier and other tools for sequence analysis. | Bioconductor [87] |
Troubleshooting Guide: Common Issues in Microbiome Data Denoising
Q1: My downstream differential abundance analysis results are unstable after denoising. What could be causing this?
Instability in differential abundance analysis often stems from how a denoising method handles zero inflation. Methods that distinguish between biological and technical zeros, like mbDenoise, provide more reliable results for downstream analysis [9]. mbDenoise uses a Zero-Inflated Probabilistic PCA (ZIPPCA) model, which models counts with a zero-inflated negative binomial distribution and uses variational approximation to learn the latent structure, thereby recovering true abundance levels using the posterior [9]. Ensure your denoising method accounts for both overdispersion and zero-inflation simultaneously. If your data exhibits strong bimodal abundance patterns (common in case-control studies), consider newer methods like BMDD (BiModal Dirichlet Distribution) which may capture this structure more effectively than unimodal assumptions [89].
Q2: How do I choose between a denoising method and a simple imputation method for my sparse microbiome dataset?
The choice hinges on the nature of zeros in your data and your analytical goals. Denoising methods like mbDenoise are superior when you need to recover the true underlying signal for downstream tasks like ordination, diversity analysis, or differential abundance testing [9]. They borrow information across samples and taxa using low-rank approximation. In contrast, simple imputation (like adding a pseudocount) does not exploit the correlation structure in the data and can introduce biases, particularly for log-scale analyses [89]. Use denoising when the proportion of technical zeros is suspected to be high. For a quick overview of how popular methods handle key data characteristics, refer to the table below.
Q3: I am getting poor clustering results after denoising. How can I improve them?
Poor clustering can occur if the denoising process oversmooths the data or fails to preserve relevant biological variation. First, verify that your denoising method is appropriate for clustering. Model-based methods like Bayesian semiparametric mixture models that explicitly account for zero-inflation and compositionality in the denoising and clustering steps simultaneously can yield more coherent clusters [53]. Secondly, ensure that the method you use, such as mbDenoise, effectively separates the biological signal from technical noise by leveraging the correlation structure between taxa and samples [9]. Finally, confirm that the low-rank approximation used in methods like mbDenoise and ALRA is not set too low, which might remove biologically important variation.
Q4: How important is it to account for experimental design in my denoising workflow?
It is crucial for complex experimental designs. If your study involves multiple factors (e.g., treatment, time, batch), methods that integrate the experimental design during denoising or subsequent analysis will provide more accurate results. While core denoising methods like mbDenoise focus on general signal recovery, newer frameworks like GLM-ASCA combine generalized linear models with ANOVA simultaneous component analysis to separate the effects of different experimental factors on microbial abundance [21]. For studies with a strong design component, consider a pipeline that first denoises the data with a robust method like mbDenoise and then uses a framework like GLM-ASCA for the analysis of variance.
Method Comparison: Key Microbiome Denoising and Imputation Tools
The table below summarizes the core characteristics of several methods discussed, providing a guide for selection.
| Method Name | Core Model / Approach | Key Features | Primary Use Case |
|---|---|---|---|
| mbDenoise [9] | Zero-Inflated Probabilistic PCA (ZIPPCA) | Uses a ZINB model and low-rank approximation; distinguishes technical vs. biological zeros. | General-purpose denoising for downstream analysis (e.g., ordination, DA). |
| BMDD [89] | BiModal Dirichlet Distribution | Models bimodal abundance distributions; suitable for case-control studies; accounts for uncertainty. | Imputation for data with bimodal patterns; improving DA analysis. |
| ALRA [9] | Low-Rank Approximation (SVD) | Uses singular value decomposition; selectively imputes values while preserving biological zeros. | Imputation for single-cell RNA-seq data; can be adapted for microbiome. |
| SAVER [9] | Poisson-Gamma Mixture Model | Borrows information across genes/cells using penalized regression; provides posterior means. | Denoising single-cell RNA-seq data. |
| mbImpute [9] | Gamma-Normal Mixture & Linear Regression | Identifies likely technical zeros and imputes them using information from similar samples/taxa. | Targeted imputation of technical zeros. |
| ZINB-Based Models [53] | Zero-Inflated Negative Binomial | A general model class that accounts for overdispersion and zero-inflation; used in various methods. | Foundational model for many custom denoising and clustering tasks. |
Experimental Protocol: Denoising Microbiome Data with mbDenoise
This protocol outlines the steps for denoising a microbiome count table using mbDenoise, a method designed to recover true abundance levels by addressing zero-inflation, overdispersion, and data redundancy [9].
1. Input Data Preparation
- Data Format: You will need a raw count matrix (e.g., OTU, ASV, or SGB table) of dimensions
nsamples (rows) byptaxa (columns) [90]. - Pre-processing: Perform standard quality control and filtering. This often includes removing taxa with extremely low prevalence (e.g., those present in less than a small percentage of samples) to reduce noise [90].
2. Software Installation and Setup
- mbDenoise is available as an R package. The source code can be accessed from its GitHub repository [91].
- Install the package in your R environment. Ensure all dependencies, such as libraries for handling variational inference and matrix operations, are installed.
3. Model Execution
- The core function of mbDenoise is executed on the count matrix. The method assumes a Zero-Inflated Negative Binomial (ZINB) model where the mean is represented by a low-rank approximation [9].
- Key Internal Steps:
- Model Fitting: The ZIPPCA model is fitted using variational approximation to learn the latent structure (low-rank representation) and estimate parameters [9].
- Posterior Estimation: The method computes the posterior means of the latent abundances, which serve as the denoised estimates [9].
- Signal Recovery: The output is a denoised abundance matrix of the same dimensions as the input, where technical noise has been reduced and technical zeros have been probabilistically imputed based on information from other samples and taxa [9].
4. Output and Downstream Analysis
- The primary output is a denoised abundance matrix. This matrix can be used for various downstream analyses, including:
The following diagram illustrates the core workflow of the mbDenoise method.
The Scientist's Toolkit: Research Reagent Solutions
| Reagent / Resource | Function / Description | Relevance to Denoising |
|---|---|---|
| 16S rRNA Sequence Data [90] | Target for amplicon sequencing; provides count data for bacterial taxa. | The primary raw input for most denoising methods like mbDenoise. Data sparsity drives the need for denoising. |
| Whole Metagenome Sequencing (WMS) Data [90] | Shotgun sequencing of all genetic material; can profile taxonomy and function. | Can be denoised using similar principles, though sparsity patterns may differ from 16S data. |
| DADA2 / QIIME 2 [90] | Bioinformatic pipelines for processing raw sequences into ASV/OTU tables. | Generates the initial count matrix that is the input for statistical denoising methods. |
| R Statistical Environment [91] [89] | Software platform for statistical computing. | The primary environment for implementing methods like mbDenoise and BMDD. |
| mbDenoise R Package [91] | Implementation of the ZIPPCA-based denoising algorithm. | Direct tool for performing microbiome data denoising as described in this guide. |
| BMDD R Package [89] | Implementation of the BiModal Dirichlet Distribution imputation framework. | Tool for imputation when bimodal abundance distributions are suspected. |
Ensuring Accuracy: Model Validation and Comparative Performance
The Role of Simulation Studies in Validating Statistical Methods
Statistical analysis of microbiome data presents unique challenges due to its special characteristics, including zero-inflation, overdispersion, high-dimensionality, and compositionality [32] [52]. These characteristics violate assumptions of traditional statistical methods, necessitating the development of specialized approaches. With numerous methods now available for differential abundance analysis, integrative analysis, and network analysis, researchers face the difficult task of selecting appropriate methods for their specific research contexts [32].
Simulation studies provide an essential framework for method validation by creating datasets with known underlying truth, enabling objective evaluation of statistical performance. As noted in recent literature, "simulating realistic microbiome data is essential for the development of novel methods" to establish validity and prove one method outperforms others [92]. This technical support guide addresses common challenges researchers encounter when designing and interpreting simulation studies for validating statistical methods targeting microbiome data complexities.
FAQ: Understanding Simulation Fundamentals
Q1: Why are simulation studies particularly important for microbiome research?
Simulation studies are crucial because microbiome data have unique characteristics that are difficult to model analytically. The field lacks consensus on optimal analysis approaches, with new methods regularly emerging. Simulations allow researchers to establish method validity under controlled conditions where the true relationships are known, which is rarely possible with real biological datasets [92].
Q2: What are the key characteristics that microbiome data simulators must capture?
A successful simulator must replicate several key data features:
- Sparsity: The majority of taxa are not present in a sample
- Overdispersion: Variance of read counts exceeds what standard parametric models assume
- Compositionality: Read counts sum to a constant per sample
- Complex correlation structures: Both between taxa and with clinical variables
- Zero-inflation: Excess zeros beyond what standard distributions predict [92] [52]
Q3: How do I determine whether a simulation accurately reflects real microbiome data?
Evaluate simulated data using multiple metrics including:
- PERMANOVA to assess group separation
- Alpha diversity measures (richness, evenness)
- Beta dispersion patterns
- Distributional similarity at both presence-absence and relative abundance levels [92] [93]
Q4: What are the limitations of current simulation approaches?
Current approaches struggle with:
- Computational efficiency for large datasets
- Capturing the full complexity of microbial ecosystems
- Accommodating rare taxa that appear in few samples
- Modeling temporal dynamics in longitudinal studies [92]
Troubleshooting Guide: Common Simulation Challenges
Handling Zero-Inflation and Overdispersion
Problem: Standard models like Zero-Inflated Negative Binomial (ZINB) regression fail to provide satisfactory fit, particularly in tail regions with outliers [88].
Solution: Consider flexible, heavy-tailed discrete models as alternatives. The discrete extended generalized Pareto distribution (DEGPD) and its zero-inflated counterpart (ZIDEGPD) offer improved performance for datasets with significant zeros and outliers [88].
Experimental Protocol:
- Simulate data points from a Negative Binomial Distribution with added zeros (e.g., 50%)
- Introduce varying levels of outliers in the response variable (low: 1%, medium: 5%, high: 10%)
- Fit both traditional ZINB and proposed ZIDEGPD models
- Compare goodness-of-fit using Akaike Information Criterion (AIC) and graphical fit assessment in tail regions [88]
Addressing Group-wise Structured Zeros
Problem: Traditional differential abundance methods struggle with "perfect separation" scenarios where one group has all non-zero counts and another has all zeros [12].
Solution: Implement a combined approach using DESeq2-ZINBWaVE for zero-inflation followed by standard DESeq2 for group-wise structured zeros.
Experimental Protocol:
- Preprocess data using quality control and contaminant removal
- Apply DESeq2-ZINBWaVE to address zero inflation
- Use standard DESeq2 with its built-in ridge-type penalized likelihood to handle perfect separation
- Validate pipeline performance using synthetic datasets with known differential abundance patterns [12]
Accounting for Taxonomic Misclassification
Problem: Conventional methods ignore measurement error in taxonomic classification, potentially biasing inference and reducing reproducibility [52].
Solution: Implement a zero-inflated Dirichlet-multinomial modeling framework (MicroMiss) that accommodates both excess zeros and potential taxonomic misclassification.
Experimental Protocol:
- Assume observed taxonomic classifications follow a multinomial distribution given true (latent) classifications
- Model true microbial abundances using a zero-inflated Dirichlet-multinomial distribution
- Incorporate covariate associations with true taxa counts and at-risk probabilities
- Use sparsity-inducing priors in high-dimensional settings to identify relevant covariates [52]
Quantitative Comparison of Simulation Approaches
Table 1: Comparison of Microbiome Data Simulation Methods
| Method | Key Features | Handles Taxa Correlations | Computational Efficiency | Best Use Cases |
|---|---|---|---|---|
| MIDASim | Two-step approach: presence-absence then relative abundance; parametric/nonparametric modes | Yes, via Gaussian copula | High | General purpose simulation; differential abundance method validation |
| Dirichlet-Multinomial (D-M) | Uses multinomial distribution with Dirichlet prior | No | High | Simple simulations without correlation structure |
| MetaSPARSim | Gamma-multivariate hypergeometric model; accounts for technical variability | No | Medium | Modeling technical variability from sequencing |
| SparseDOSSA | Zero-inflated log-normal marginal distributions | Yes | Low (can take >24 hours) | Template-based simulations with complex distributions |
| MB-GAN/DeepMicroGen | Deep neural networks; autonomously learns data structure | Yes | Very Low | Complex data structures; longitudinal studies |
Table 2: Performance of Statistical Methods for Zero-Inflated Data
| Method | Handling of Zero-Inflation | Overdispersion Control | Outlier Robustness | Implementation |
|---|---|---|---|---|
| DESeq2-ZINBWaVE | Uses ZINBWaVE weights | Good | Limited | R package |
| ZINB | Two-component mixture: point mass at zero + count distribution | Moderate | Poor | Multiple R packages |
| ZIDEGPD | Zero-inflated discrete extended generalized Pareto | Good | Excellent | Specialized code |
| edgeR | Based on negative binomial distribution | Good | Limited | R/Bioconductor |
| ANCOM | Compositional approach via log-ratios | Moderate | Moderate | R package |
| MicroMiss | Zero-inflated Dirichlet-multinomial with misclassification | Good | Moderate | Specialized Bayesian framework |
Experimental Protocols for Key Validation Studies
Comprehensive Method Benchmarking Protocol
Data Generation: Use MIDASim in parametric mode to generate synthetic microbiome datasets with known differentially abundant taxa. Vary key parameters: effect size, zero-inflation rate, and sample size [92].
Method Application: Apply multiple differential abundance methods (DESeq2, edgeR, limma-voom, ANCOM, etc.) to the simulated datasets.
Performance Evaluation: Calculate:
- False Discovery Rate (proportion of falsely identified significant taxa)
- Statistical Power (proportion of true differentially abundant taxa correctly identified)
- Computational time
- Robustness to varying zero-inflation rates [12]
Sensitivity Analysis: Repeat under different normalization strategies (TMM, RLE, CSS) and filtering thresholds.
Correlation Analysis Validation Protocol
Template Selection: Use real microbiome-metabolome dataset as template to ensure realistic correlation structures [14].
Framework Application: Implement ISCAZIM framework which:
- Benchmarks multiple correlation methods (Pearson, Spearman, ZINB, mutual information)
- Classifies correlation patterns as linear or non-linear
- Applies correlation methods according to zero-inflation rates [14]
Validation: Compare identified association pairs with known biological relationships.
Performance Assessment: Evaluate accuracy by measuring recovery of true positive associations while controlling false discoveries.
Visualization of Simulation Workflows
MIDASim Simulation Workflow
Differential Analysis Pipeline for Structured Zeros
The Scientist's Toolkit: Essential Research Reagents
Table 3: Key Statistical Tools for Microbiome Data Analysis
| Tool/Reagent | Function | Application Context |
|---|---|---|
| MIDASim | Simulates realistic microbiome data with proper correlation structure | Method validation and benchmarking |
| ISCAZIM | Integrated statistical correlation analysis for zero-inflated microbiome data | Microbiome-metabolome association studies |
| DESeq2-ZINBWaVE | Differential abundance testing with zero-inflation weights | Identifying differentially abundant taxa in sparse data |
| ZIDEGPD | Heavy-tailed discrete model for zero-inflated count data with outliers | Modeling datasets with extreme values and high zero-inflation |
| MicroMiss | Zero-inflated Dirichlet-multinomial model with misclassification | Accounting for taxonomic classification errors |
| ANCOM | Compositional approach to differential abundance testing | When compositionality is primary concern |
| SparseDOSSA | Hierarchical model for simulating synthetic abundances | Template-based simulation with complex distributions |
Simulation studies remain indispensable for validating statistical methods in microbiome research, particularly for addressing zero-inflation and overdispersion. As methodological development continues, future directions should focus on:
- Improved computational efficiency for simulating large-scale microbiome datasets
- Better incorporation of biological constraints and ecological principles
- Standardized evaluation metrics for comparing simulation performance
- Integration of multiple data types (multi-omics) in simulation frameworks
By adhering to rigorous simulation practices and utilizing appropriate tools, researchers can develop and validate statistical methods that robustly address the unique challenges of microbiome data, ultimately advancing our understanding of microbiome-host interactions in health and disease.
Frequently Asked Questions
1. My differential abundance analysis produces different results with different tools. Which method is the most reliable? Disturbingly, different differential abundance analysis (DAA) tools can produce discordant results, making biomarker discovery challenging [94] [95]. Comprehensive benchmarking studies indicate that no single method is universally superior across all settings [95]. However, some consistently robust performers exist:
- For Correlated Data (e.g., longitudinal): Linear model-based methods like LinDA, MaAsLin2, and LDM are generally more robust than generalized linear model-based methods. LinDA is noted as the only method that maintains reasonable performance even in the presence of strong compositional effects [94].
- For Independent Data: Methods that explicitly address compositional effects, such as ANCOM-BC, ALDEx2, and metagenomeSeq (fitFeatureModel), show improved false-positive control [95].
The key is not to blindly apply any single method. Using an optimized procedure like ZicoSeq, or testing multiple robust methods to see if results converge, is a more reliable strategy for robust microbiome biomarker discovery [95].
2. How do I choose between Poisson, Negative Binomial, and zero-inflated models for my count data? Choosing the right model depends on diagnosing your data's properties. The table below outlines the core considerations:
| Model | Best Used When | Key Assumption | Adequacy for Microbiome Data |
|---|---|---|---|
| Poisson Regression [3] [96] | Data shows no overdispersion and no excess zeros. | Equidispersion (mean = variance). | Often inadequate due to inherent overdispersion and zero-inflation [95]. |
| Negative Binomial (NB) Regression [3] [96] | Data is overdispersed (variance > mean) but does not have a large excess of zeros. | Variance is a function of the mean (allowing for overdispersion). | A good starting point for overdispersed count data [3]. |
| Zero-Inflated Poisson (ZIP) / Negative Binomial (ZINB) [3] | Data has a large number of zeros that cannot be explained by the standard Poisson or NB distributions. | Zeros come from two latent groups: a "structural" group (always zero) and a "sampling" group (at risk, but zero by chance). | Highly relevant, but the increased complexity can lead to overfitting and instability if not truly needed [95]. |
| Hurdle Models (HUP/HUNB) [3] | The entire population is at risk, and all zeros are modeled as a single structural process. | A single process determines whether the count is zero or positive; a separate process models the positive counts. | A strong alternative to zero-inflated models, often with better interpretability in certain contexts [3]. |
Diagnostic Workflow:
- Test for Overdispersion: After fitting a Poisson model, check if the residual deviance is significantly larger than the residual degrees of freedom. Formal score tests can also be used [97].
- Check for Zero-Inflation: If your data has a large proportion of zeros, compare a standard NB model to a ZINB model using a Vuong test [96] or goodness-of-fit statistics like AIC/BIC [3]. The Vuong test helps determine if the zero-inflated model provides a significantly better fit.
- Interpretability: Choose between ZINB and HUNB based on your research question and the assumption about the nature of zeros (two latent groups vs. one group for all zeros) [3].
3. The variance in my microbiome counts increases with the mean. How can I account for this heteroscedasticity? Heteroscedasticity (overdispersion) is a fundamental characteristic of microbiome count data [98] [95]. Simply using a Poisson model will lead to biased standard errors and misleading inferences [98]. Robust solutions include:
- Negative Binomial Models: This is a standard parametric approach that directly models overdispersion with an extra parameter [3] [95].
- Robust Variance Estimation: A simple yet powerful framework involves using a Poisson (log-linear) model for the mean structure and then employing robust methods to estimate the covariance matrix. This provides reliable inference even if the distributional assumption is wrong [98].
4. What are the critical experimental confounders I must account for in my microbiome study design? The human microbiome is highly sensitive to its environment. Failing to account for key confounders can completely confound your results [99]. Critical factors to document and control for include:
- Medications: Antibiotics and other prescription drugs (e.g., proton pump inhibitors) have a profound impact [99].
- Demographics: Age, sex, and geography are strongly associated with microbiome composition [99].
- Lifestyle & Diet: Long-term and short-term dietary patterns, as well as factors like pet ownership, are significant influencers [99].
- Technical Variation: Batch effects from DNA extraction kits and other reagents are a major source of variation. It is best to process all samples using the same batch of kits [99].
- Longitudinal Instability: Some body sites (e.g., vagina) have naturally fluctuating microbiomes, so understanding the baseline stability of your sample type is crucial [99].
- Cage Effects (Animal Studies): Mice housed together share microbiota through coprophagia. You must house experimental groups in multiple cages and treat "cage" as a variable in the statistical analysis [99].
Experimental Protocols
Protocol 1: Real Data-Based Simulation for Benchmarking DAA Methods
This semiparametric framework generates realistic correlated microbiome data for robustly evaluating the performance (Power & Type I Error) of differential abundance analysis methods [94].
- Template Data Selection: Obtain a large, well-characterized microbiome dataset (e.g., from the Integrative Human Microbiome Project) to serve as a non-parametric template.
- Composition Inference: For each sample drawn from the template, infer the underlying true composition using an empirical Bayesian model [94].
- Parametric Effect Introduction: Introduce covariate or confounder effects to the composition vector using a log-linear model. This allows you to spike in known differential abundance signals.
- Read Count Generation: Simulate the sequencing process by generating sequence reads from the modified composition using a multinomial model.
- Performance Evaluation: Apply the DAA methods to the simulated data and compare the reported differential taxa to the known "true" signals. Calculate:
- Power: The proportion of true differential taxa correctly identified.
- Type I Error / FDR: The proportion of non-differential taxa incorrectly flagged as significant.
This approach combines the distributional complexity of real data with the controlled setting of a simulation, providing a more realistic benchmark than purely parametric simulators [94].
Protocol 2: Power and Sample Size Calculation for Microbiome Studies
A priori power analysis is crucial for designing a valid study that can reliably test its hypotheses [100].
- Define Hypothesis and Model: Clearly state your null hypothesis and specify the intended statistical test (e.g., negative binomial regression for count outcomes, PERMANOVA for community-level differences).
- Estimate Key Parameters: Use pilot data or previous literature to estimate:
- Effect Size: The expected fold-change in abundance for a taxon of interest.
- Baseline Abundance: The mean abundance of the taxon in the reference group.
- Dispersion Parameter: The level of overdispersion in the count data [3].
- Expected Variance: For community-level analyses, an estimate of within-group multivariate variance (e.g., the expected Beta-diversity).
- Run Calculation: Use statistical software (R is common) with dedicated packages for microbiome power analysis. Input the parameters from step 2, along with your desired statistical power (typically 80%) and significance level (typically 5%).
- Iterate and Report: Calculate the required sample size for a range of plausible effect sizes to understand the sensitivity of your design. Report all parameters used in the calculation for transparency [100].
Visual Workflows
The Scientist's Toolkit: Essential Research Reagents & Solutions
| Category | Item | Function / Explanation |
|---|---|---|
| Statistical Methods | LinDA [94] | Linear model-based DAA for correlated data, robust to compositional effects. |
| MaAsLin2 [94] | General-purpose DAA tool using LMM or GLM, good for correlated data. | |
| ANCOM-BC [95] | DAA method designed to control false positives by addressing compositionality. | |
| ZINB & Hurdle NB Models [3] | For analyzing zero-inflated and overdispersed count data. | |
| Normalization Methods | GMPR [95] | Geometric mean of pairwise ratios; a robust normalization for zero-inflated data. |
| TMM & CSS [95] | Trimmed Mean of M-values and Cumulative Sum Scaling; robust scaling factors. | |
| CLR / ILR Transformation [101] | Centered/Isometric Log-Ratio; transforms data to address compositionality. | |
| Software & Tests | R Packages (pscl) [3] |
Provides functions for zero-inflated and hurdle models, and the Vuong test. |
| Python Implementation [96] | Custom code for the Vuong test, enabling model comparison in Python. | |
lme4 & glmmTMB [94] |
R packages for fitting generalized linear mixed models (GLMM) for correlated data. |
Frequently Asked Questions
FAQ 1: What are the primary statistical challenges when analyzing microbiome count data for differential abundance? Microbiome data presents unique statistical challenges that require specialized analytical approaches. The three main challenges are:
- Zero-inflation: A large proportion of the data are zeros, which arise from both true biological absence and technical limitations in sequencing depth [63] [54].
- Over-dispersion: The variance in the data significantly exceeds the mean, violating the assumptions of standard models like the Poisson distribution [63] [54].
- Compositionality: The data represents relative, not absolute, abundances. A change in the abundance of one taxon affects the perceived proportions of all others [102].
FAQ 2: Which differential abundance methods are recommended for handling these challenges? No single method is universally best, and results can vary. It is highly recommended to use multiple methods to verify consistent findings [102]. The table below summarizes tools that address these challenges effectively.
| Method | Approach to Zero-Inflation | Approach to Compositionality | Key Model/Feature |
|---|---|---|---|
| ALDEx2 [102] | Bayesian imputation | Centered Log-Ratio (CLR) transformation | Uses Dirichlet distribution to estimate technical variation. |
| ANCOM-BC [103] [102] | Pseudo-count strategy | Bias-corrected log-ratios | Accounts for sample-specific sampling fractions. |
| DESeq2 [103] [102] | Uses alternative size factor estimators ("iterate", "poscounts") [103] | Relative Log Expression (RLE) normalization | Negative binomial model; filter sparse features first. |
| ZIBB [54] | Zero-inflated mixture model | Not explicitly stated | Zero-Inflated Beta-Binomial model; models mean-variance relationship. |
| MaAsLin3 [102] | Pseudo-count strategy | Various normalizations (TMM, CLR, etc.) | Flexible, generalized linear models. |
FAQ 3: My PERMANOVA results are significant, but I cannot find differentially abundant taxa with other methods. Why? This discrepancy occurs because PERMANOVA and similar distance-based analyses (e.g., using Bray-Curtis or UniFrac) test whether whole microbial communities differ between groups. A significant result confirms overall composition is different but does not identify which specific taxa are driving the change. Differential abundance analysis is then needed to pinpoint these individual biomarkers [104] [102].
FAQ 4: How should I preprocess my data before running a differential abundance analysis? Proper preprocessing is critical for reproducible results.
- Agglomerate Features: Combine data at a specific taxonomic level (e.g., Genus) to reduce complexity [103] [102].
- Prevalence Filtering: Filter out rare taxa that are present in only a small percentage of samples (e.g., less than 10%). This helps to reduce noise and sparsity [102].
- Address Sparse Features: For methods like DESeq2, proactively filter features with a very high percentage of zeros (e.g., >90%) to improve model fitting [103].
Troubleshooting Guides
Problem: Inconsistent or conflicting results from different differential abundance methods.
Solution: This is a common issue due to the differing underlying assumptions of each tool [102]. Follow this systematic workflow to validate your findings.
- Action 1: Run your analysis through a panel of methods from the table above (e.g., ALDEx2, ANCOM-BC, and DESeq2) [102].
- Action 2: Treat taxa identified by multiple, methodologically distinct tools as high-confidence candidates.
- Action 3: For inconsistent results, investigate the assumptions of each method. A method assuming a negative binomial distribution might fail on a highly zero-inflated taxon better suited for a zero-inflated model like ZIBB [54] [102].
- Action 4: Use the
benchdamicR package for a comprehensive evaluation and comparison of differential abundance methods on your specific dataset [102].
Problem: Model convergence failures or errors during analysis.
Solution: This often stems from data that is too sparse or has insufficient variation.
- Action 1: Increase Prevalence Filtering. Agglomerate to a higher taxonomic level (e.g., Genus instead of Species) and apply more stringent prevalence filtering (e.g., from 10% to 20%). This reduces the number of uninformative zeros and features with near-constant values [103] [102].
- Action 2: Check for Confounding Factors. Ensure that the observed variation is due to the condition of interest (e.g., obesity) and not a confounding variable (e.g., batch effect, age, diet). Include these variables as covariates in your model if possible [102].
- Action 3: Use Alternative Estimators. In DESeq2, if you encounter errors related to zeros, use the
type="poscounts"ortype="iterate"arguments in theestimateSizeFactorsfunction instead of adding a pseudo-count to the entire dataset [103].
Experimental Protocol: A Typical Differential Abundance Analysis Workflow
This protocol outlines the steps from a raw feature table to identifying differentially abundant taxa in a case-control study (e.g., obese vs. healthy children).
1. Data Input and Preprocessing
- Input Data: Start with a feature table (OTU/ASV counts), a taxonomy table, and sample metadata [103].
- Software/Tools: R programming environment with packages like
phyloseq[103]. - Steps:
2. Core Differential Abundance Analysis with ANCOM-BC ANCOM-BC is a recommended method as it directly addresses compositionality and is robust in many settings [103] [102].
- Theory: ANCOM-BC (Analysis of Compositions of Microbiomes with Bias Correction) uses a linear regression model with a bias-correction term for the log-ratios of abundances. It does not require pseudo-counts and accounts for the differences in sample-specific sampling fractions [102].
- Code Example:
- Output Interpretation: The result will provide, for each taxon, a log-fold change (logFC), p-value, and adjusted p-value (q-value) between the obese and healthy groups. A positive logFC indicates higher abundance in obese children.
3. Validation with a Second Method (e.g., ALDEx2)
- Theory: ALDEx2 uses a Dirichlet-multinomial model to generate posterior probabilities for the data, then applies a centered log-ratio (CLR) transformation. It uses standard statistical tests (e.g., Welch's t-test) on the transformed data [102].
- Code Example:
- Action: Compare the list of significant taxa from ANCOM-BC and ALDEx2. Taxa identified by both methods are high-confidence biomarkers.
The Scientist's Toolkit: Research Reagent Solutions
| Item / Resource | Function / Application |
|---|---|
| QIIME 2 | A powerful, extensible pipeline for processing raw sequencing data into feature tables and phylogenetic trees [103]. |
| R Environment | The primary platform for statistical analysis and visualization of microbiome data [103] [102]. |
phyloseq R Package |
An R package that integrates feature tables, taxonomy, metadata, and phylogeny into a single object, streamlining analysis [103]. |
mia R Package |
Part of the OMA ecosystem, provides tools and data structures for microbiome analysis in R [102]. |
ANCOMBC R Package |
Implements the ANCOM-BC method for differential abundance analysis that accounts for compositionality and sample-specific biases [102]. |
ALDEx2 R Package |
Implements the ALDEx2 method for differential abundance analysis using a Dirichlet model and CLR transformation [102]. |
DESeq2 R Package |
A general-purpose tool for RNA-seq analysis that can be applied to microbiome data with careful preprocessing to handle zeros [103] [102]. |
benchdamic R Package |
Provides a framework for benchmarking different differential abundance methods on your dataset to guide method selection [102]. |
| BEEM-Static Algorithm | An R package that uses a generalized Lotka-Volterra model to infer microbial interaction networks from cross-sectional data, useful for advanced dynamic insights [105]. |
Comparative Analysis of Key Metrics in Obesity Microbiome Studies
The following table synthesizes quantitative findings from gut microbiome studies investigating obesity, highlighting consistent patterns.
| Metric / Taxon | Trend in Obesity (vs. Lean) | Notes and Context |
|---|---|---|
| Firmicutes/Bacteroidetes Ratio | Frequently reported to be higher [106] [105] | A commonly cited biomarker, though not universally consistent [105]. |
| Firmicutes Carrying Capacity | Consistently higher [105] | Inferred from microbial interaction models using BEEM-Static. |
| Proteobacteria Carrying Capacity | Consistently higher [105] | Inferred from microbial interaction models using BEEM-Static. |
| Bacteroidetes → Firmicutes Interaction | Stronger inhibition (e.g., -0.41 vs -0.26) [105] | The inhibitory effect is more negative in obese individuals. |
| Microbial Interaction Network | More complex (57 vs 37 interactions) [105] | Obese individuals showed a higher number of significant microbial interactions. |
| Negative Interactions | 79% in obese vs 92% in lean [105] | Suggests a shift in the balance of cooperative and competitive interactions. |
| Global Adult Obesity Prevalence | ~39% [106] [105] | Establishes the public health significance of the research context. |
Frequently Asked Questions (FAQs)
FAQ 1: Under what data conditions should I choose a Zero-Inflated model over a Hurdle model? Choose a Zero-Inflated (ZI) model when your data generation process suggests that zeros can arise from two distinct mechanisms: a "structural" source (the taxon is genuinely absent or the subject is not at risk) and a "sampling" source (the taxon is present but was not detected in the count process) [107]. The ZI model explicitly models this two-component origin of zeros using a mixture of a point mass at zero and a standard count distribution (e.g., Poisson or Negative Binomial) [107]. This is conceptually different from a Hurdle model, which treats all zeros as originating from a single process, typically modeled by a binary component, while the positive counts are modeled by a zero-truncated count distribution [107].
FAQ 2: My dataset has a high proportion of zeros, but also shows over-dispersion (variance > mean). Which models are most appropriate? For data exhibiting both zero-inflation and over-dispersion, the Zero-Inflated Negative Binomial (ZINB) and Hurdle Negative Binomial models are the most appropriate choices [107] [10] [12]. The Negative Binomial component in both models specifically accounts for the over-dispersion that a standard Poisson model cannot capture. The ZINB model allows for over-dispersion arising from both excess zeros and heterogeneity in the count process, whereas the Hurdle NB model addresses over-dispersion primarily in the positive count component [107].
FAQ 3: What are "group-wise structured zeros" and how do they impact differential abundance testing? Group-wise structured zeros occur when a taxon has all zero counts in one experimental group but non-zero counts in another group [12]. This presents a significant challenge for statistical inference, often leading to large or infinite parameter estimates and inflated standard errors when using standard maximum likelihood-based techniques [12]. In differential abundance analysis, such a pattern can be biologically meaningful, indicating a taxon is abundant in one condition but entirely absent in another. Methods like DESeq2, which use a penalized likelihood approach, can help provide finite parameter estimates in these situations [12].
FAQ 4: How does the compositional nature of microbiome data affect model selection? Microbiome data are compositional because the counts in each sample sum to a fixed total (library size), meaning abundances are only interpretable on a relative scale [90] [32]. This characteristic can lead to spurious correlations if not properly accounted for [108]. When selecting a model, it is crucial to choose methods that either inherently adjust for compositionality (e.g., some graphical models or methods using log-ratio transformations) or to include library size (e.g., as an offset) in count-based models like ZINB or Hurdle models to mitigate its effects [64] [32].
Troubleshooting Guides
Problem: Model fails to converge during parameter estimation.
- Potential Cause 1: The model is too complex for the data, often due to a high number of covariates or a small sample size.
- Solution: Simplify the model by reducing the number of covariates. Increase sample size if possible. For ZINB models, consider using a simpler model like a Zero-Inflated Poisson (ZIP) if over-dispersion is minimal, though this is rare in microbiome data [10].
- Potential Cause 2: The presence of complete separation or group-wise structured zeros.
- Solution: Use statistical methods that implement a penalized likelihood, such as DESeq2, which can provide finite estimates in the presence of all zeros in one group [12].
- Potential Cause 3: Poor initialization of parameters in the optimization algorithm.
- Solution: Use method-of-moments estimates or estimates from a simpler model (e.g., a standard Negative Binomial) as starting values for the ZI or Hurdle model estimation routine.
Problem: Poor model fit as indicated by residual diagnostics.
- Potential Cause: The chosen distribution (e.g., Poisson) does not adequately capture the data's variance structure, leading to under- or over-fitting.
- Solution:
- Switch Distributions: Move from a Poisson to a Negative Binomial base distribution to account for over-dispersion [107] [10].
- Use Randomized Quantile Residuals (RQR): Calculate RQRs to assess model fit. If the model is correctly specified, RQRs should be approximately normally distributed. Patterns in the plot of RQRs against predicted values indicate a poor fit [107].
- Compare Models: Use information criteria like Akaike Information Criterion (AIC) to compare the fit of ZI versus Hurdle models, and Poisson versus Negative Binomial variants. The model with the lower AIC is generally preferred [107].
- Solution:
Problem: Inflated false discovery rate (FDR) in differential abundance analysis.
- Potential Cause: Failure to adequately account for zero-inflation and the resulting misinterpretation of the excess zeros.
- Solution: Employ a two-pronged strategy:
- For general zero-inflation, use a method that incorporates weights based on a ZINB model (e.g., DESeq2-ZINBWaVE) to control the FDR [12].
- For taxa with group-wise structured zeros, apply a method with a penalized likelihood (e.g., standard DESeq2) to properly test for significance [12].
- Ensure proper filtering of low-prevalence taxa prior to analysis to reduce the burden of multiple testing, but be aware that highly-inflated zeros often remain and require specialized modeling [12].
- Solution: Employ a two-pronged strategy:
Table 1: Comparison of Key Count Model Characteristics for Microbiome Data
| Model | Data Generating Process | Handling of Zeros | Model Flexibility | Typical Use Case |
|---|---|---|---|---|
| Standard Poisson | Single process: Counts from Poisson(μ) [107]. | Assumes zeros are from Poisson process; underestimates with excess zeros. | Low: Assumes mean = variance. | Baseline; not recommended for sparse microbiome data. |
| Negative Binomial (NB) | Single process: Counts from NB(μ, r) [107]. | Same as Poisson, but can have more zeros due to over-dispersion. | Medium: Accounts for over-dispersion via dispersion parameter r [107]. | Over-dispersed count data without excess zeros. |
| Zero-Inflated Poisson (ZIP) | Two process:1. Structural zeros (prob π).2. Counts from Poisson(μ) (prob 1-π) [107]. | Models two types of zeros: structural & sampling. | Medium: Accounts for zero-inflation but not over-dispersion. | Zero-inflated data where over-dispersion is not significant. |
| Zero-Inflated NB (ZINB) | Two process:1. Structural zeros (prob π).2. Counts from NB(μ, r) (prob 1-π) [107]. | Models two types of zeros: structural & sampling. | High: Accounts for both zero-inflation and over-dispersion [107] [10]. | Most microbiome data (sparse and over-dispersed). |
| Hurdle Model | Two process:1. Binary: Zero vs. non-zero.2. Counts from zero-truncated distribution (e.g., Poisson, NB) [107]. | Models all zeros with a single binary process. | High: Can use various truncated distributions (e.g., NB for over-dispersion) [107]. | Data where the "presence/absence" decision process is distinct from the "abundance given presence" process. |
Table 2: Decision Matrix for Model Selection Based on Data Properties
| Data Property | Recommended Model(s) | Rationale |
|---|---|---|
| Low zero-inflation, no over-dispersion | Standard Poisson | The simplest model that fits the data structure. |
| Low zero-inflation, but over-dispersed | Negative Binomial | The NB model's dispersion parameter captures extra-Poisson variation [107]. |
| High zero-inflation, no over-dispersion | Zero-Inflated Poisson (ZIP) | The ZIP model accounts for excess zeros beyond the Poisson expectation [107]. |
| High zero-inflation and over-dispersion | ZINB or Hurdle NB | Both models handle the two key features of microbiome data. Choice depends on the theoretical basis for zero generation [107] [12]. |
| Group-wise structured zeros | Penalized methods (e.g., DESeq2) | Standard ZI/Hurdle MLE may fail; penalized likelihood provides stable estimates [12]. |
Experimental Protocols
Protocol 1: Benchmarking Differential Abundance Methods for Sparse Data This protocol outlines a pipeline for comparing methods when analyzing data with zero-inflation and group-wise structured zeros [12].
- Data Simulation: Use a tool like
SparseDOSSA2to simulate microbiome count data that mirrors real experimental data, incorporating known differentially abundant taxa, zero-inflation, and over-dispersion [12]. - Data Pre-processing: Apply a filtering step to remove taxa with extremely low prevalence (e.g., present in less than 10% of samples) to reduce noise and the multiple testing burden [12].
- Normalization: Normalize the data to account for variable sequencing depths. The Median-of-Ratios method (DESeq2) or Trimmed Mean of M-values (TMM in edgeR) are common choices [12] [32].
- Differential Abundance Testing: Apply a combination of methods:
- Performance Evaluation: Calculate performance metrics such as False Discovery Rate (FDR), True Positive Rate (TPR/Recall), and Area Under the Precision-Recall Curve (AUPRC) to compare methods against the ground truth from the simulation.
Protocol 2: Model Selection and Goodness-of-Fit Assessment using Randomized Quantile Residuals This protocol describes how to evaluate whether a fitted model adequately describes the observed microbiome data [107].
- Model Fitting: Fit a set of candidate models to the same dataset (e.g., NB, ZINB, Hurdle NB).
- Residual Calculation: For each model, compute the Randomized Quantile Residuals (RQRs). If the model is correct, these residuals should follow a standard normal distribution [107].
- Diagnostic Plotting: Create two key plots for each model:
- A Q-Q plot of the RQRs against the standard normal distribution. Deviation from the straight line indicates a poor fit.
- A scatterplot of RQRs against model-predicted values. The residuals should be randomly scattered around zero; any discernible pattern suggests model misspecification [107].
- Model Comparison: Compare models using information criteria like AIC. The model with the lowest AIC is typically preferred. The results from the residual diagnostics should be consistent with the AIC ranking [107].
Visual Workflows
Model Selection Workflow: A decision pathway for selecting an appropriate statistical model based on the characteristics of microbiome count data.
Research Reagent Solutions
Table 3: Essential Software Tools for Analyzing Zero-Inflated Microbiome Data
| Tool / Reagent | Category | Primary Function | Application Note |
|---|---|---|---|
| DESeq2 [12] | Differential Abundance | A method based on a negative binomial GLM with shrinkage estimation. | Its penalized likelihood framework helps handle the issue of group-wise structured zeros, providing stable results where other models may fail [12]. |
| ZINBWaVE [12] | Weighting / Model | A tool for estimating weights for zero-inflated data. | Not a direct testing tool, but its weights can be incorporated into packages like DESeq2 and edgeR to improve their performance on zero-inflated data (DESeq2-ZINBWaVE) [12]. |
| mbDenoise [9] | Pre-processing / Denoising | A latent variable model for denoising microbiome data using a Zero-Inflated Probabilistic PCA (ZIPPCA) approach. | Useful for recovering true abundance levels by borrowing information across samples and taxa before downstream analyses like ordination or differential abundance testing [9]. |
| COZINE [108] | Network Analysis | Infers microbial ecological networks from compositional and zero-inflated data. | Uses a multivariate Hurdle model to infer conditional dependencies without needing pseudo-counts, capturing relationships in both presence/absence and abundance [108]. |
| ISCAZIM [14] | Correlation Analysis | A framework for correlation analysis between microbiome and metabolome data. | Benchmarks multiple correlation methods (e.g., Pearson, Spearman, ZINB) and applies them based on zero-inflation rates and correlation patterns in the data [14]. |
The Giloteaux et al. study, published in Microbiome in 2016, was a foundational investigation into the gut microbiome in Myalgic Encephalomyelitis/Chronic Fatigue Syndrome (ME/CFS). The study aimed to determine whether ME/CFS was associated with an altered gut microbiome and to investigate potential evidence of microbial translocation into the bloodstream [109].
The key findings from the study are summarized in the table below.
Table 1: Key Experimental Findings from the Giloteaux et al. Study
| Analysis Category | Key Finding | Measurement/Method | Statistical Significance (P-value) |
|---|---|---|---|
| Gut Microbiome Diversity | Decreased bacterial diversity in ME/CFS patients | 16S rRNA sequencing (V4 region), Phylogenetic Diversity (PD) metric | P = 0.004 [109] |
| Microbial Composition | Reduction in relative abundance and diversity of Firmicutes; increase in pro-inflammatory species | Analysis of 97% ID OTUs | Reported as significant [109] |
| Microbial Translocation Markers | Elevated plasma Lipopolysaccharide (LPS) levels | Plasma LPS assay | P < 0.0005 [109] |
| Microbial Translocation Markers | Elevated plasma LPS-binding protein (LBP) levels | Plasma LBP assay | P < 0.0005 [109] |
| Microbial Translocation Markers | Elevated plasma soluble CD14 (sCD14) levels | Plasma sCD14 assay | P < 0.0005 [109] |
| Diagnostic Model | Machine learning classification accuracy (16S rRNA + inflammatory markers) | Cross-validation | 82.93% accuracy [109] |
Detailed Experimental Protocols
Subject Recruitment and Characteristics
- Cases: 48 individuals diagnosed with ME/CFS by a specialist according to the Fukuda diagnostic criteria [109].
- Controls: 39 self-reported healthy volunteers [109].
- Clinical Data: ME/CFS subjects completed the SF-36 form and Bell's Disability Scale to quantify health status and disability [109].
Laboratory Methods
A. 16S rRNA Gene Sequencing of Stool Microbiome
- DNA Extraction: From fecal samples.
- Target Amplification: The hypervariable V4 region of the 16S rRNA gene was amplified and sequenced [109].
- Sequencing Platform: High-throughput sequencing generated an average of 98,093 ± 29,231 reads per sample [109].
- Bioinformatic Processing:
B. Plasma Marker Analysis
Blood was drawn to assess systemic inflammation and microbial translocation. The following markers were measured [109]:
- LPS (Lipopolysaccharide): A marker of microbial translocation from the gut.
- LBP (LPS-Binding Protein) & sCD14: Proteins produced in response to LPS exposure.
- I-FABP (Intestinal Fatty Acid-Binding Protein): A marker for gastrointestinal tract integrity.
- hsCRP (high-sensitivity C-Reactive Protein): A general inflammatory marker.
Statistical Analysis Workflow
The study employed a multi-faceted statistical approach [109]:
- Diversity Analysis: Within-sample (alpha) diversity was compared using the Phylogenetic Diversity (PD) metric and the Wilcoxon rank-sum test.
- Differential Abundance: Compositional differences in microbial taxa between groups were analyzed.
- Correlation Analysis: Associations between plasma biomarker levels (e.g., LPS, sCD14, LBP) were assessed.
- Machine Learning: A model was built using the 16S rRNA and inflammatory marker data to classify individuals as ME/CFS or healthy.
Troubleshooting Common Analysis Issues (FAQs)
FAQ 1: How do I handle the excess zeros in microbiome count data from a study like Giloteaux's?
- Problem: Microbiome data is often zero-inflated (~45% zeros in some datasets [63]), which can distort standard statistical models.
- Solution: Use models specifically designed for zero-inflated and over-dispersed count data. Do not replace zeros with arbitrary pseudo-counts, as this can introduce bias [63] [11].
- Recommended Methods:
- Zero-Inflated Models: Zero-Inflated Negative Binomial (ZINB) or Zero-Inflated Generalized Poisson (ZIGP) models [63] [65] [46].
- Model-Based Frameworks: The
GZIGPFAmodel or theBAMZINB(Bayesian Marginal Zero-inflated Negative Binomial) model are advanced options that explicitly handle these characteristics [63] [46].
FAQ 2: The Giloteaux study found decreased diversity, but my analysis shows conflicting results. What could be the cause?
- Problem: Inconsistent diversity results can stem from different normalization methods or failure to account for compositionality and varying library sizes [32] [11].
- Solution:
- Normalization: Always apply a normalization method to control for unequal sequencing depth. Common methods include [32] [11] [2]:
- Cumulative Sum Scaling (CSS) (e.g., in
metagenomeSeq) - Relative Log Expression (RLE) (e.g., in
DESeq2) - Trimmed Mean of M-values (TMM)
- Cumulative Sum Scaling (CSS) (e.g., in
- Rarefying: An alternative is rarefying (subsampling to an even depth), though this is debated as it discards data [11].
- Normalization: Always apply a normalization method to control for unequal sequencing depth. Common methods include [32] [11] [2]:
FAQ 3: How can I robustly identify associations between microbiome composition and clinical covariates (e.g., inflammation markers)?
- Problem: Standard correlation methods (Pearson, Spearman) can be impaired by zero-inflation, over-dispersion, and compositionality [65].
- Solution: Employ a flexible framework that adapts to the data's characteristics.
- ISCAZIM Framework: This method benchmarks multiple correlation methods (Spearman, ZINB, Mutual Information) and automatically selects the best one based on the zero-inflation rate and correlation pattern in your data [65].
- Multivariate Association Models: Tools like
MaAsLin2(Microbiome Multivariate Associations with Linear Models) are designed to find associations between microbial communities and complex metadata while accounting for confounding factors [67].
FAQ 4: The Giloteaux study used OTUs. Should I use OTUs or ASVs?
- Problem: Choosing between Operational Taxonomic Units (OTUs) and Amplicon Sequence Variants (ASVs) can impact resolution and reproducibility.
- Solution: ASVs are generally recommended for new studies. ASVs provide a higher-resolution, reproducible unit by inferring exact biological sequences, unlike OTUs which cluster sequences based on an arbitrary similarity threshold (e.g., 97%) [2]. Modern pipelines like
DADA2anddecontamare widely used for ASV generation and contamination removal [67] [2].
Statistical Handling of Zero-Inflation and Over-Dispersion
The Giloteaux study highlights the critical need for proper statistical handling of microbiome data. The diagram below outlines a recommended analytical decision workflow.
Table 2: Statistical Methods for Microbiome Data Analysis
| Analytical Goal | Method/Tool | Key Feature | Reference in Search Results |
|---|---|---|---|
| Differential Abundance | ANCOM-BC |
Accounts for compositionality and false discovery rate | [32] [67] |
| Differential Abundance | DESeq2, edgeR |
Adopted from RNA-seq; handles over-dispersion | [32] [67] [11] |
| Differential Abundance | corncob |
Uses beta-binomial regression to model abundance and dispersion | [32] [67] |
| Zero-Inflated Modeling | GZIGPFA |
Generalized Poisson factor analysis for zero-inflated counts | [63] |
| Zero-Inflated Modeling | BAMZINB |
Bayesian approach for zero-inflated, over-dispersed multivariate data | [46] |
| Correlation Analysis | ISCAZIM |
Adaptive framework that selects the best correlation method based on data | [65] |
| Network Analysis | SPIEC-EASI, NetCoMi |
Constructs and compares microbial ecological networks from compositional data | [67] |
The Scientist's Toolkit: Research Reagent Solutions
Table 3: Essential Materials and Tools for Microbiome Research
| Item/Tool | Function/Purpose | Example/Note |
|---|---|---|
| 16S rRNA Primers | Amplify the bacterial 16S gene for sequencing. | Target the V4 region (e.g., 515F/806R) as used in Giloteaux [109]. |
| Plasma Preparation Tubes | Collect blood plasma for biomarker analysis. | Essential for measuring LPS, LBP, sCD14, and cytokines [109]. |
| DNA Extraction Kit | Isolate microbial genomic DNA from stool samples. | Must be effective for Gram-positive and Gram-negative bacteria. |
| ELISA Kits | Quantify specific protein biomarkers in plasma/serum. | Used to measure LBP, sCD14, I-FABP, and cytokine levels [109]. |
| Bioinformatic Pipelines | Process raw sequencing data into analyzable OTUs/ASVs. | QIIME 2, mothur, DADA2 [67] [2]. |
| Statistical Software | Perform specialized microbiome statistical analysis. | R packages: phyloseq, metagenomeSeq, DESeq2, MaAsLin2 [32] [67]. |
| Reference Databases | Assign taxonomy to 16S rRNA sequences. | Greengenes, SILVA [2]. |
Conclusion
Effectively handling zero-inflation and overdispersion is not merely a statistical exercise but a prerequisite for generating reproducible and biologically meaningful conclusions from microbiome data. The journey from foundational understanding to methodological application underscores the necessity of specialized models like ZINB and hurdle models, which consistently demonstrate superior control over false positives and enhanced power. Troubleshooting through rigorous preprocessing and informed model selection is critical, while validation via simulation and real-data benchmarking confirms the robustness of these advanced approaches. For future biomedical research, the integration of Bayesian methods, improved denoising techniques, and frameworks that simultaneously handle compositionality, sparsity, and measurement error will be pivotal. These advancements will accelerate the translation of microbiome insights into clinical diagnostics and therapeutic interventions, solidifying the microbiome's role in precision medicine.
References
- 1. Microbiome FAQs - Protocols [https://protocols.hostmicrobe.org/microbial-genomics-faqs]
- 2. Tools for Analysis of the Microbiome - PMC [https://pmc.ncbi.nlm.nih.gov/articles/PMC7598837/]
- 3. Models for Analyzing Zero-Inflated and Overdispersed ... [https://pmc.ncbi.nlm.nih.gov/articles/PMC7364829/]
- 4. Current progresses and challenges for microbiome ... [https://www.frontiersin.org/journals/cellular-and-infection-microbiology/articles/10.3389/fcimb.2024.1377012/full]
- 5. How to Troubleshoot Sequencing Preparation Errors (NGS ... [https://www.cd-genomics.com/resource-sequencing-preparation-troubleshooting.html]
- 6. "Modeling Overdispersion Data with Zero-Inflated Poisson ... [https://digitalcommons.wayne.edu/jmasm/vol12/iss1/28/]
- 7. Microbiome characterization by high-throughput transfer ... [https://www.nature.com/articles/s41467-018-07675-z]
- 8. Naught all zeros in sequence count data are the same - PMC [https://pmc.ncbi.nlm.nih.gov/articles/PMC7568192/]
- 9. mbDenoise: microbiome data denoising using zero-inflated ... [https://genomebiology.biomedcentral.com/articles/10.1186/s13059-022-02657-3]
- 10. A GLM-based zero-inflated generalized Poisson factor ... [https://pmc.ncbi.nlm.nih.gov/articles/PMC11173601/]
- 11. Statistical normalization methods in microbiome data with ... [https://pmc.ncbi.nlm.nih.gov/articles/PMC10461514/]
- 12. A strategy for differential abundance analysis of sparse ... [https://www.nature.com/articles/s41598-024-62437-w]
- 13. Microbiome differential abundance methods produce ... [https://www.nature.com/articles/s41467-022-28034-z]
- 14. ISCAZIM: Integrated statistical correlation analysis for zero- ... [https://www.sciencedirect.com/science/article/pii/S2405844024172155]
- 15. Zero inflated high dimensional compositional data with ... [https://journals.plos.org/plosone/article?id=10.1371/journal.pone.0320832]
- 16. Zero-Inflated Poisson Regression | R Data Analysis Examples [https://stats.oarc.ucla.edu/r/dae/zip/]
- 17. Methodology for microbiome data analysis: An overview [https://www.sciencedirect.com/science/article/abs/pii/S0010482525005086]
- 18. Do We Really Need Zero-Inflated Models? [https://statisticalhorizons.com/zero-inflated-models/]
- 19. The Ridge-Hurdle Negative Binomial Regression Model [https://www.mdpi.com/2571-905X/8/4/102]
- 20. New two parameter hybrid estimator for zero inflated ... [https://www.nature.com/articles/s41598-025-06116-4]
- 21. Analysis of microbiome high-dimensional experimental ... [https://www.frontiersin.org/journals/microbiomes/articles/10.3389/frmbi.2025.1584516/full]
- 22. Microbiome Datasets Are Compositional: And This Is Not ... [https://www.frontiersin.org/journals/microbiology/articles/10.3389/fmicb.2017.02224/full]
- 23. Analysis of Microbiome Data in the Presence of Excess Zeros [https://pmc.ncbi.nlm.nih.gov/articles/PMC5682008/]
- 24. Statistical analysis of microbiome data: The challenge ... [https://www.sciencedirect.com/science/article/abs/pii/S2451965021000600]
- 25. Statistical challenges in longitudinal microbiome data analysis [https://pmc.ncbi.nlm.nih.gov/articles/PMC9294433/]
- 26. coda4microbiome: compositional data analysis for ... [https://bmcbioinformatics.biomedcentral.com/articles/10.1186/s12859-023-05205-3]
- 27. Composite quantile regression approach to batch effect ... [https://www.frontiersin.org/journals/microbiology/articles/10.3389/fmicb.2025.1484183/full]
- 28. Statistical Analysis of Metagenomics Data - PMC [https://pmc.ncbi.nlm.nih.gov/articles/PMC6459172/]
- 29. ... | ZYMO RESEARCH 16 S Sequencing vs Shotgun Metagenomic [https://www.zymoresearch.com/blogs/blog/16s-sequencing-vs-shotgun-metagenomic-sequencing]
- 30. between Comparison and 16 for... S rRNA shotgun sequencing data [https://www.nature.com/articles/s41598-021-82726-y?error=cookies_not_supported&code=68c51e85-97c5-4e5e-a521-6543d860f5a1]
- 31. between Comparison and 16 in... S rRNA shotgun sequencing [https://bmcgenomics.biomedcentral.com/articles/10.1186/s12864-024-10621-7]
- 32. A Survey of Statistical Methods for Microbiome Data Analysis [https://www.frontiersin.org/journals/applied-mathematics-and-statistics/articles/10.3389/fams.2022.884810/full]
- 33. Zero-Inflated gaussian mixed models for analyzing ... [https://journals.plos.org/plosone/article?id=10.1371/journal.pone.0242073]
- 34. Prospective Comparison Between Shotgun and... Metagenomics [https://pmc.ncbi.nlm.nih.gov/articles/PMC9020828/]
- 35. phyloseq Frequently Asked Questions (FAQ) [http://bioconductor.posit.co/packages/3.23/bioc/vignettes/phyloseq/inst/doc/phyloseq-FAQ.html]
- 36. Check for (and fix) common problems with phyloseq objects [https://david-barnett.github.io/microViz/reference/phyloseq_validate.html]
- 37. DESeq2 dealing with 0 in OTU table · Issue #642 [https://github.com/joey711/phyloseq/issues/642]
- 38. Error estimates for the analysis of differential expression from ... [https://pmc.ncbi.nlm.nih.gov/articles/PMC4179614/]
- 39. DESeq2 with phyloseq - GitHub Pages [https://joey711.github.io/phyloseq-extensions/DESeq2.html]
- 40. A comparison of statistical methods for modeling count ... [https://pmc.ncbi.nlm.nih.gov/articles/PMC9351158/]
- 41. Zero-Inflated Models for Rare Event Prediction [https://medium.com/@amit25173/zero-inflated-models-for-rare-event-prediction-9dd2ec6af614]
- 42. Negative binomial factor regression with application ... [https://pmc.ncbi.nlm.nih.gov/articles/PMC9325477/]
- 43. Negative binomial mixed models for analyzing microbiome ... [https://bmcbioinformatics.biomedcentral.com/articles/10.1186/s12859-016-1441-7]
- 44. Univariate and Multivariate Statistical Analysis of ... [https://www.mdpi.com/2673-8007/3/2/23]
- 45. BMDD: A probabilistic framework for accurate imputation of ... [https://pmc.ncbi.nlm.nih.gov/articles/PMC12582502/]
- 46. Infants' gut microbiome data: A Bayesian Marginal Zero- ... [https://www.sciencedirect.com/science/article/pii/S2001037023000715]
- 47. Hurdle model [https://en.wikipedia.org/wiki/Hurdle_model]
- 48. Statistical modeling on human microbiome sequencing data [https://www.aimspress.com/article/doi/10.3934/bdia.2019001?viewType=HTML]
- 49. 5.6 Zero-Inflated and Hurdle Models | Stan User's Guide [https://mc-stan.org/docs/2_24/stan-users-guide/zero-inflated-section.html]
- 50. Poisson hurdle model-based method for clustering ... [https://pubmed.ncbi.nlm.nih.gov/36469352/]
- 51. Zero-Inflated and Hurdle Models for Count Data - OARC Stats [https://stats.oarc.ucla.edu/wp-content/uploads/2024/03/Zero_inf_2024_2.html]
- 52. Analyzing microbiome data with taxonomic misclassification ... [https://bmcbioinformatics.biomedcentral.com/articles/10.1186/s12859-025-06078-4]
- 53. A Bayesian Semiparametric Mixture Model for Clustering ... [https://arxiv.org/html/2508.14184]
- 54. A Zero-inflated Beta-binomial Model for Microbiome Data ... [https://pmc.ncbi.nlm.nih.gov/articles/PMC6124506/]
- 55. Finite mixture representations of zero-and-N-inflated ... [https://www.sciencedirect.com/science/article/abs/pii/S0047259X25000879]
- 56. A New Dirichlet‐Multinomial Mixture Regression Model for the ... [https://pmc.ncbi.nlm.nih.gov/articles/PMC12330782/]
- 57. Comparison study of differential abundance testing methods ... [https://bmcbioinformatics.biomedcentral.com/articles/10.1186/s12859-021-04193-6]
- 58. Investigating differential abundance methods in ... [https://pmc.ncbi.nlm.nih.gov/articles/PMC9488820/]
- 59. FrederickHuangLin/ANCOMBC [https://github.com/FrederickHuangLin/ANCOMBC]
- 60. DESeq2 error on analyzing microbiome data · Issue #12 [https://github.com/mikelove/DESeq2/issues/12]
- 61. edgeR troubleshooting - transcriptomics [https://help.galaxyproject.org/t/edger-troubleshooting/12189]
- 62. differentialabundance: Usage [https://nf-co.re/differentialabundance/dev/docs/usage]
- 63. A GLM-based zero-inflated generalized Poisson factor ... [https://www.frontiersin.org/journals/microbiology/articles/10.3389/fmicb.2024.1394204/full]
- 64. Zero-inflated Poisson factor model with application to ... [https://pmc.ncbi.nlm.nih.gov/articles/PMC7594114/]
- 65. ISCAZIM: Integrated statistical correlation analysis for zero ... [https://pubmed.ncbi.nlm.nih.gov/39811376/]
- 66. ZINQ-L: a zero-inflated quantile approach for differential ... [https://www.frontiersin.org/journals/genetics/articles/10.3389/fgene.2024.1494401/full]
- 67. Tools for microbiome anlaysis - Sudarshan [https://microsud.github.io/Tools-Microbiome-Analysis/]
- 68. MicrobiomeAnalyst [https://www.microbiomeanalyst.ca/]
- 69. Batch effects removal for microbiome data via conditional ... [https://www.nature.com/articles/s41467-022-33071-9]
- 70. Composite quantile regression approach to batch effect ... [https://pmc.ncbi.nlm.nih.gov/articles/PMC11893821/]
- 71. MBECS: Microbiome Batch Effects Correction Suite [https://bmcbioinformatics.biomedcentral.com/articles/10.1186/s12859-023-05252-w]
- 72. Parameter estimations of zero-inflated negative binomial ... [https://www.sciencedirect.com/science/article/abs/pii/S0307904X24000337]
- 73. Group-wise normalization in differential abundance ... [https://arxiv.org/html/2411.15400v1]
- 74. Comparison of normalization methods for the analysis of ... [https://bmcgenomics.biomedcentral.com/articles/10.1186/s12864-018-4637-6]
- 75. TimeNorm: a novel normalization method for time course ... [https://www.frontiersin.org/journals/genetics/articles/10.3389/fgene.2024.1417533/full]
- 76. Zero-Inflated Beta Regression for Differential Abundance ... [https://pmc.ncbi.nlm.nih.gov/articles/PMC6109378/]
- 77. Comparison of the effectiveness of different normalization ... [https://www.nature.com/articles/s41598-024-57670-2]
- 78. Akaike Information Criterion | When & How to Use It ... [https://www.scribbr.com/statistics/akaike-information-criterion/]
- 79. Akaike information criterion [https://en.wikipedia.org/wiki/Akaike_information_criterion]
- 80. A comparison of zero-inflated and hurdle models for ... [https://pmc.ncbi.nlm.nih.gov/articles/PMC8570364/]
- 81. Vuong's closeness test [https://en.wikipedia.org/wiki/Vuong%27s_closeness_test]
- 82. 14.2 Non-Nested Model Tests | A Guide on Data Analysis [https://bookdown.org/mike/data_analysis/non-nested-model-tests.html]
- 83. A Bayesian nonparametric analysis for zero-inflated ... [https://pmc.ncbi.nlm.nih.gov/articles/PMC10338028/]
- 84. Addressing Misclassification in the Microbiome: A Data-Scientific Approach to Propagating Uncertainty in Microbial Community Composition | Research | UW–Madison [https://research.wisc.edu/addressing-misclassification-in-the-microbiome-a-data-scientific-approach-to-propagating-uncertainty-in-microbial-community-composition/]
- 85. Statistical Methods for Overdispersed Count Data [https://shop.elsevier.com/books/statistical-methods-for-overdispersed-count-data/dupuy/978-1-78548-266-3]
- 86. Embracing Ambiguity in the Taxonomic Classification of Microbiome Sequencing Data - PMC [https://pmc.ncbi.nlm.nih.gov/articles/PMC6811648/]
- 87. IDTAXA: a novel approach for accurate taxonomic classification of microbiome sequences | Microbiome | Full Text [https://microbiomejournal.biomedcentral.com/articles/10.1186/s40168-018-0521-5]
- 88. Flexible model for varying levels of zeros and outliers in ... [https://arxiv.org/html/2510.27365v1]
- 89. BMDD: A probabilistic framework for accurate imputation of ... [https://journals.plos.org/ploscompbiol/article?id=10.1371/journal.pcbi.1013124]
- 90. Analysis of Microbiome Data - PMC - PubMed Central [https://pmc.ncbi.nlm.nih.gov/articles/PMC11218911/]
- 91. YanyZeng/mbDenoise: Marker gene ... [https://github.com/YanyZeng/mbDenoise]
- 92. MIDASim: a fast and simple simulator for realistic microbiome ... [https://microbiomejournal.biomedcentral.com/articles/10.1186/s40168-024-01822-z]
- 93. Key features and guidelines for the application of microbial ... [https://www.nature.com/articles/s41598-024-77864-y]
- 94. Benchmarking differential abundance analysis methods for ... [https://pmc.ncbi.nlm.nih.gov/articles/PMC9851339/]
- 95. A comprehensive evaluation of microbial differential ... [https://microbiomejournal.biomedcentral.com/articles/10.1186/s40168-022-01320-0]
- 96. A New Computational Algorithm for Assessing ... [https://www.mdpi.com/2073-431X/13/4/88]
- 97. Testing overdispersion in the zero-inflated Poisson model [https://www.sciencedirect.com/science/article/abs/pii/S0378375809000810]
- 98. Simplified methods for variance estimation in microbiome ... [https://pmc.ncbi.nlm.nih.gov/articles/PMC11532193/]
- 99. Optimizing methods and dodging pitfalls in microbiome research [https://microbiomejournal.biomedcentral.com/articles/10.1186/s40168-017-0267-5]
- 100. power and sample size calculation for microbiome studies [https://www.sciencedirect.com/science/article/pii/S1933021922017366]
- 101. A systematic benchmark of integrative strategies for ... [https://www.nature.com/articles/s42003-025-08515-9]
- 102. 17 Differential abundance – Orchestrating Microbiome Analysis [https://microbiome.github.io/OMA/docs/devel/pages/differential_abundance.html]
- 103. Tutorial for microbiome analysis in R - Yan Hui [https://www.yanh.org/2021/01/01/microbiome-r/]
- 104. GIMIC: smoothed graph-image representation of ... [https://pmc.ncbi.nlm.nih.gov/articles/PMC12512389/]
- 105. Predicting gut microbiota dynamics in obese individuals ... [https://www.frontiersin.org/journals/cellular-and-infection-microbiology/articles/10.3389/fcimb.2025.1485791/full]
- 106. Research trends between childhood obesity and gut microbiota [https://pmc.ncbi.nlm.nih.gov/articles/PMC11466780/]
- 107. A comparison of zero-inflated and hurdle models for modeling ... [https://jsdajournal.springeropen.com/articles/10.1186/s40488-021-00121-4]
- 108. Compositional zero-inflated network estimation for ... [https://bmcbioinformatics.biomedcentral.com/articles/10.1186/s12859-020-03911-w]
- 109. Reduced diversity and altered composition of the gut ... [https://microbiomejournal.biomedcentral.com/articles/10.1186/s40168-016-0171-4]