Unlocking Hidden Microbial Worlds: Advanced Strategies for DNA Extraction from Dormant Microorganisms
This article provides a comprehensive guide for researchers and industry professionals on extracting high-quality DNA from dormant microbial states.
Unlocking Hidden Microbial Worlds: Advanced Strategies for DNA Extraction from Dormant Microorganisms
Abstract
This article provides a comprehensive guide for researchers and industry professionals on extracting high-quality DNA from dormant microbial states. It explores the unique physiological challenges posed by spores, persister cells, and viable-but-non-culturable (VBNC) organisms, detailing optimized methodological workflows, common pitfalls, and validation strategies. By synthesizing current best practices, the content aims to enhance microbiome analysis, drug discovery, and clinical diagnostics where dormant populations are critical.
Understanding Dormancy: Why Standard DNA Extraction Fails for Spores and Persister Cells
Technical Support Center
This support center provides troubleshooting guidance for common experimental challenges encountered when studying microbial dormancy in the context of DNA extraction efficiency for downstream genomic analyses.
Troubleshooting Guides & FAQs
FAQ: Low DNA Yield from Spore Preparations
- Issue: Inefficient lysis of bacterial endospores (e.g., Bacillus, Clostridium) leads to poor DNA yield.
- Solution: Implement a mechanical lysis step. Use bead beating with 0.1mm zirconia/silica beads for 3-5 minutes after a chemical lysozyme treatment. Ensure the initial heat activation step (65-70°C for 15 min) was performed to weaken the spore coat.
FAQ: False-Negative PCR from VBNC Cells
- Issue: Failure to detect VBNC cells (e.g., E. coli, Vibrio vulnificus) via PCR despite viability assays indicating presence.
- Solution: This often stems from inefficient DNA extraction from cells with intact but metabolically inactive membranes. Use a combined lysozyme (1 mg/mL, 37°C, 30 min) and proteinase K (0.5 mg/mL, 56°C, 60 min) pre-treatment. Increase the rigor of mechanical lysis. Employ PMAxx or EMA dye treatment prior to DNA extraction to selectively inhibit amplification from dead cells with compromised membranes, confirming the VBNC signal is from intact cells.
FAQ: Inconsistent Persister Cell Enrichment
- Issue: High variability in persister cell (Mycobacterium tuberculosis, Staphylococcus aureus) numbers after antibiotic treatment (e.g., ciprofloxacin) hinders reproducible DNA extraction for sequencing.
- Solution: Standardize the growth phase precisely. Persister levels peak in late stationary phase. Use a defined inoculation density and growth time. After antibiotic treatment, wash cells 3x with sterile PBS or medium containing 0.01% Tween-80 to prevent clumping and carryover, which can cause colony-forming variability.
FAQ: Co-Extraction of Inhibitors from Dormant Cells
- Issue: DNA extracts from dormant biomass (e.g., environmental spores) inhibit downstream enzymatic reactions (PCR, restriction digest).
- Solution: Dormant structures often contain complex polysaccharides and dipicolinic acid (spores) that co-purify. Use a silica-column-based clean-up kit specifically designed for soil or stool samples. Include a pre-wash step with inhibitor removal buffers containing guanidine thiocyanate. Quantify inhibition using a spiked internal control PCR.
Table 1: Comparative Analysis of Dormancy States & DNA Yield
| Dormancy State | Example Genera | Key Lysis Challenge | Typical DNA Yield (ng/10^8 cells) | Recommended Primary Lysis Method |
|---|---|---|---|---|
| Endospores | Bacillus, Clostridium | Rigid spore coat, SASP proteins | 50-150 | Bead beating + Chemical (Lysozyme, DTT) |
| VBNC Cells | Escherichia, Vibrio | Altered, resilient cell envelope | 80-200 | Enzymatic (Lysozyme+Proteinase K) + Mechanical |
| Persister Cells | Staphylococcus, Pseudomonas | Normal cell envelope, tolerant physiology | 200-400 | Standard enzymatic lysis (Gram +/- specific) |
Table 2: Impact of Lysis Method on DNA Fragment Size & Downstream Application
| Lysis Method | Avg. Fragment Size (bp) | Suitability for PCR | Suitability for Long-Read Sequencing |
|---|---|---|---|
| Boiling + SDS | 300-500 | Moderate | Poor |
| Enzymatic Only | 5,000-15,000 | Good | Moderate |
| Bead Beating (30s) | 2,000-5,000 | Excellent | Poor |
| Bead Beating (90s) | 500-1,500 | Good | Poor |
| Sonicator (Shearing) | 150-700 | Good | Poor |
Experimental Protocols
Protocol 1: DNA Extraction from Bacillus subtilis Spores for Efficient Recovery
- Heat Activation: Resuspend purified spore pellet in sterile water. Heat at 70°C for 15 minutes.
- Chemical Pre-treatment: Pellet spores. Resuspend in TE buffer with 1 mg/mL lysozyme and 10 mM DTT. Incubate at 37°C for 60 min.
- Mechanical Lysis: Transfer to a tube containing 0.1mm zirconia beads. Bead beat at 6.5 m/s for 45 seconds, chill on ice for 2 minutes. Repeat 3x.
- Digestion & Purification: Add Proteinase K and SDS to final 0.5 mg/mL and 1% w/v. Incubate at 56°C for 2 hours. Proceed with phenol-chloroform extraction or commercial column purification.
Protocol 2: Differentiating VBNC from Dead Cells using PMAxx-qPCR
- Sample Treatment: Divide sample into two aliquots (+PMAxx and -PMAxx control).
- Dye Binding: Add PMAxx dye to the treated aliquot to a final concentration of 50 µM. Incubate in the dark for 10 minutes at room temperature.
- Photoactivation: Expose both tubes to a high-intensity LED photolysis light (465-475 nm) for 15 minutes on ice.
- DNA Extraction & qPCR: Extract DNA from both aliquots using your standard protocol. Perform identical qPCR assays. Calculate the ΔCq (CqPMAxx - Cqcontrol). A ΔCq > 2-3 indicates a significant population of intact (VBNC) cells.
Visualizations
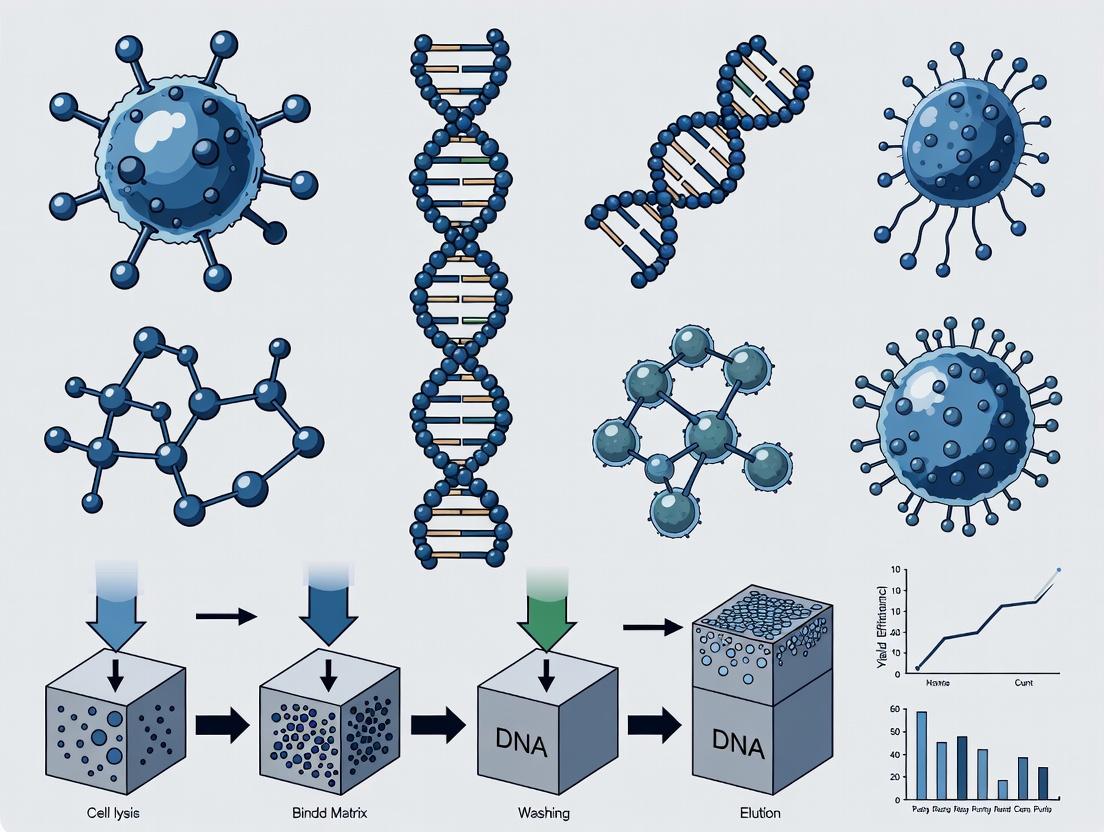
Dormant Cell DNA Extraction Workflow
Key Pathways to Persister Cell Formation
The Scientist's Toolkit: Research Reagent Solutions
Table 3: Essential Reagents for Dormant Microbe DNA Studies
| Reagent / Material | Primary Function | Application Note |
|---|---|---|
| Zirconia/Silica Beads (0.1mm) | Mechanical disruption of tough cell walls/spore coats. | Essential for endospores and environmental samples. Use in bead beater. |
| Lysozyme | Enzymatic degradation of peptidoglycan in bacterial cell walls. | Critical pre-treatment for Gram-positive spores and VBNC cells. |
| Proteinase K | Broad-spectrum protease; degrades proteins and inactivates nucleases. | Used after initial lysis to digest cellular proteins and release DNA. |
| Dithiothreitol (DTT) | Reducing agent; breaks disulfide bonds in spore coat proteins. | Enhances spore coat permeability for lysis reagents. |
| PMAxx or EMA Dyes | Photoactive DNA intercalators; penetrate compromised membranes. | Viability-qPCR; selectively blocks PCR from dead-cell DNA. |
| Guanidine Thiocyanate (GuSCN) | Chaotropic salt; denatures proteins, inhibits RNases, aids cell lysis. | Core component of many lysis buffers; helps remove inhibitors. |
| Dipicolinic Acid (DPA) Standard | Chemical standard for spore quantification via fluorescence. | Calibrating assays to estimate spore numbers pre-lysis. |
| Stationary Phase Culture Media | Maintains culture at late log/stationary phase to induce persisters. | Critical for reproducible persister cell enrichment experiments. |
Technical Support Center: Troubleshooting DNA Extraction from Dormant Microorganisms
This support center provides targeted solutions for researchers facing challenges in extracting high-quality, representative DNA from dormant microbial populations for metagenomic analysis, pathogen detection, and drug discovery.
Frequently Asked Questions (FAQs)
Q1: My DNA yield from environmental samples (e.g., soil, sediment) is extremely low. I suspect tough Gram-positive cell walls are the problem. What are my options? A: Low yield from robust cell walls requires enhanced mechanical or enzymatic lysis. Current best practices recommend a combined approach:
- Pre-treatment: Incubate samples with lysozyme (10-20 mg/mL, 37°C, 30 min) to degrade peptidoglycan.
- Enhanced Mechanical Lysis: Use a high-speed bead-beating protocol with a 1:1 mix of 0.1mm and 0.5mm zirconia/silica beads for 2-3 cycles of 45 seconds at 6.0 m/s, with 2-minute intervals on ice to prevent overheating.
- Chemical Lysis Follow-up: After bead-beating, add a lysis buffer containing CTAB (2% w/v) and proteinase K (0.1 mg/mL) and incubate at 56°C for 1 hour. This sequential protocol addresses multiple wall layers effectively.
Q2: I am targeting endospores (e.g., Bacillus, Clostridium). Standard kits fail to lyse them. How can I improve efficiency? A: Endospores have highly protective coats. A mandatory physical-chemical lysis step is required:
- Protocol: Resuspend the pelleted spore sample in a solution of 0.5% SDS and 50mM EDTA (pH 8.0). Subject the suspension to three cycles of freeze-thawing using liquid nitrogen and a 65°C water bath. Follow this with a heat shock at 80°C for 20 minutes. After this pre-treatment, proceed with a standard enzymatic lysis (lysozyme + mutanolysin) and purification. This disrupts the spore coat and cortex.
Q3: How can I mitigate DNA damage from harsh lysis methods needed for tough cells? A: Harsh methods shear DNA. To protect high-molecular-weight DNA:
- Buffer Optimization: Increase the concentration of EDTA (e.g., 50-100mM) in your lysis buffer to chelate metal ions and inhibit nucleases.
- Add Protective Agents: Include proteinase K early to degrade nucleases and consider adding scavengers like 1% (w/v) polyvinylpyrrolidone (PVP) to bind phenolic compounds in environmental samples.
- Gentle Post-Lysis: After initial lysis, avoid vortexing. Use wide-bore pipette tips for all transfers of lysate.
Q4: My sample has low metabolic activity, leading to low biomass and high inhibitor carryover (humic acids, polysaccharides). How do I clean the DNA? A: For inhibitor-prone samples, post-extraction purification is critical.
- Gel Electrophoresis & Excison: Run your crude extract on a low-melt agarose gel. Excise the high-molecular-weight DNA band, avoiding the lower smear where inhibitors often co-migrate.
- Specialized Clean-up: Use purification columns specifically designed for environmental samples (e.g., with inhibitor-removal wash buffers). Alternatively, perform a CTAB-chloroform isoamyl alcohol (24:1) extraction (2x) after initial lysis but before alcohol precipitation, which effectively removes polysaccharides and humics.
Q5: How do I verify that my extraction is representative and not biased against dormant cells? A: Employ internal controls and community profiling:
- Spike-in Control: Add a known quantity of cells with a very different, non-native cell wall (e.g., Micrococcus luteus as a Gram-positive control into a soil sample) prior to lysis. Quantify its recovery via qPCR with specific primers post-extraction to gauge lysis efficiency across cell types.
- Metrics: Analyze your 16S rRNA gene amplicon profile and compare the relative abundance of known tough-to-lyse taxa (e.g., Mycobacteria, Actinobacteria, endospore-formers) against a benchmark meta-analysis from similar samples. Significant under-representation suggests lysis bias.
The following table synthesizes recent comparative data on DNA yield and quality from model dormant structures.
Table 1: Comparative Efficiency of Lysis Methods on Resilient Microbial Forms
| Target Structure (Model Organism) | Standard Kit Yield (ng DNA/10^6 cells) | Optimized Method (See Protocols) | Optimized Method Yield (ng DNA/10^6 cells) | DNA Integrity Number (DIN) - Optimized |
|---|---|---|---|---|
| Gram-positive Cell Wall (Mycobacterium smegmatis) | 15.2 ± 3.1 | Bead-beating (3x45s) + Lysozyme/Proteinase K | 102.5 ± 12.7 | 7.8 |
| Bacterial Endospore (Bacillus subtilis spore) | 2.1 ± 0.8 | Freeze-Thaw (3x) + Heat Shock + Enzymatic Lysis | 89.4 ± 10.3 | 6.5 |
| Protozoan Cyst (Giardia lamblia cyst) | 22.5 ± 5.4 | Glass Bead Vortexing (5 min) + SDS/Proteinase K @ 65°C | 156.8 ± 18.9 | 8.1 |
| Environmental Biofilm (Mixed Community) | Varies Widely | Sequential: Mechanical Disruption → CTAB/EDTA → IAC Purification | 2-5x increase vs. standard* | 6.5 - 8.0 |
*Yield increase is sample-dependent; data shows consistent significant improvement in yield and reduction in inhibitor co-purification.
Experimental Protocols
Protocol 1: Sequential Lysis for Complex Environmental Biomass (Soil/Sediment) Objective: Maximize lysis of diverse cell types while preserving DNA integrity.
- Homogenization: Weigh 0.5 g of sample. Add to 2 mL tube with 0.3g of 0.1mm and 0.3g of 0.5mm zirconia beads.
- Primary Mechanical Lysis: Add 1 mL of pre-chilled Lysis Buffer A (100mM Tris-HCl pH 8.0, 100mM EDTA, 1.5M NaCl). Bead-beat at 6.5 m/s for 60 seconds. Place on ice for 120 seconds. Repeat for 3 cycles total.
- Enzymatic Lysis: Transfer supernatant to a new tube. Add Lysozyme to 20 mg/mL and Mutanolysin to 200 U/mL. Incubate at 37°C for 60 min with gentle inversion.
- Chemical Lysis: Add SDS to 2% (w/v) and Proteinase K to 0.2 mg/mL. Incubate at 56°C for 120 min.
- Purification: Add CTAB to final 1% and incubate at 65°C for 15 min. Extract with chloroform:isoamyl alcohol (24:1). Precipitate DNA with isopropanol. Wash with 70% ethanol. Resuspend in TE buffer with RNAse A.
Protocol 2: Internal Amplification Control (IAC) Preparation for Lysis Efficiency QC Objective: Create a non-native, quantifiable control to assess extraction bias.
- Control Culture: Grow Micrococcus luteus (or similar) to mid-log phase in TSB.
- Fixation & Washing: Harvest cells. Wash 3x in 1X PBS. Resuspend in PBS with 4% formaldehyde for 1 hour at 4°C to halt metabolism (simulate dormancy). Wash thoroughly 5x with PBS to remove fixative.
- Quantification & Storage: Count cells via hemocytometer. Adjust concentration to 1 x 10^9 cells/mL in PBS with 10% glycerol. Store at -80°C in aliquots.
- Usage: Spike a known volume (e.g., 10 µL containing 1e7 cells) into your sample before the first lysis step. After DNA extraction, quantify using M. luteus-specific qPCR (e.g., targeting gyrB gene) to calculate recovery percentage.
Visualizations
Optimized DNA Extraction & Quality Control Workflow (96 chars)
Barrier Targeted by Lysis Method Strategy (98 chars)
The Scientist's Toolkit: Research Reagent Solutions
Table 2: Essential Reagents for Overcoming Extraction Barriers
| Item | Function in Protocol | Key Consideration |
|---|---|---|
| Zirconia/Silica Beads (0.1 & 0.5mm mix) | Mechanical shearing of tough cell walls and spores. | Mix sizes improve lysis efficiency across cell sizes. Pre-clean with acid to avoid contaminant DNA. |
| Lysozyme | Enzymatically hydrolyzes β-1,4-glycosidic bonds in peptidoglycan (Gram-positive walls). | Use high-purity, molecular biology grade. Activity decreases in high-salt buffers; optimize buffer. |
| Mutanolysin | Cleaves the glycan strands of peptidoglycan, synergistic with lysozyme. | Essential for certain Actinobacteria. Store aliquots at -20°C. |
| CTAB (Cetyltrimethylammonium bromide) | Precipitates polysaccharides and humic acids while keeping nucleic acids in solution. | Use above 0.5M NaCl to keep nucleic acids soluble. Requires chloroform extraction for removal. |
| Proteinase K | Broad-spectrum serine protease degrades nucleases and cellular proteins. | Critical for inhibitor removal. Ensure lysis buffer has adequate EDTA to protect DNA. |
| EDTA (Ethylenediaminetetraacetic acid) | Chelates Mg2+ and other divalent cations, inhibiting DNases. | Use high concentration (50-100mM) for tough samples. pH must be ~8.0 for effective chelation. |
| PVP (Polyvinylpyrrolidone) | Binds and precipitates phenolic compounds prevalent in environmental samples. | Use with high-humic acid samples (e.g., soil, peat). Often added to initial lysis buffer. |
| Internal Amplification Control (IAC) Cells | Non-target cells spiked pre-lysis to quantify extraction efficiency and bias. | Must be phylogenetically distant, have known resistance, and be quantifiable via unique primers. |
Technical Support Center: Troubleshooting DNA Extraction for Dormant Microbe Research
FAQs & Troubleshooting Guides
Q1: My 16S rRNA amplicon sequencing results show very low microbial diversity and are dominated by a few highly abundant taxa. Could this be due to extraction bias? A: Yes, this is a classic sign of lysis bias. Dormant microorganisms (e.g., spores, Gram-positive bacteria) have robust cell structures resistant to standard lysis methods. Your protocol likely selectively lyses "easy-to-lyse" cells, skewing community representation.
- Solution: Implement a bead-beating step with a mixture of zirconia/silica beads (0.1mm and 0.5mm) for mechanical disruption. Validate extraction efficiency using a mock microbial community with known proportions of hard-to-lyse cells (e.g., Bacillus subtilis spores, Mycobacterium).
Q2: During metagenomic analysis, I detect high human host DNA contamination, overwhelming microbial signals. How can I mitigate this? A: Host DNA contamination is a major bias, especially in low-biomass samples, reducing sequencing depth for the microbiome.
- Solution: Incorporate a host DNA depletion step pre- or post-extraction. Use kits with selective lysis buffers or enzymatic digestion (e.g., Benzonase) targeting host DNA. For stool samples, differential centrifugation can enrich for microbial cells.
Q3: My viability staining (e.g., PMA, EMA) shows a high proportion of dead cells, but my molecular assay still amplifies their DNA. Is my drug efficacy test against dormant cells valid? A: This indicates insufficient viability dye penetration or cross-linking, leading to false-positive signals from dormant/compromised cells—a critical bias in drug discovery.
- Solution: Optimize dye concentration and light exposure time. Combine with a robust DNA extraction method. For true functional dormancy assessment, pair molecular data with culture-enrichment techniques (e.g., supplementation with resuscitation-promoting factors).
Q4: When testing novel antimicrobial compounds, how can I ensure I'm targeting the metabolically active versus dormant portion of the microbiome? A: Standard minimum inhibitory concentration (MIC) assays fail against dormant cells. Relying solely on them introduces a "dormancy blind spot" in drug discovery.
- Solution: Employ a multi-assay approach:
- Culture under Resuscitation Conditions: Use multiple nutrient-rich and dilute media, extended incubation.
- Metabolic Activity Probes: Use stable isotope probing (SIP) with heavy water (D₂O) or ¹³C-labeled substrates to trace de novo synthesis in cells post-treatment.
- Viability-qPCR: Use PMA or similar dyes coupled with taxon-specific qPCR to quantify intact cells from target taxa.
Key Experimental Protocol: Evaluating DNA Extraction Efficiency for Dormant Cells
Objective: To compare and benchmark commercial and in-house DNA extraction kits for their efficiency in lysing dormant bacterial endospores.
Materials:
- Mock Community: Contains known quantities of E. coli (Gram-negative, vegetative), Lactobacillus acidophilus (Gram-positive, vegetative), and Bacillus atrophaeus spores (dormant).
- Extraction Kits: Kit A (enzymatic/chemical lysis only), Kit B (includes bead-beating).
- Equipment: Bead beater, thermomixer, centrifuge, qPCR system.
- Primers: Taxon-specific 16S rRNA gene primers for each mock community member.
Method:
- Sample Preparation: Spike equal genomic copy numbers (from pre-quantified stocks) of each mock community member into a sterile, inert matrix.
- DNA Extraction: In parallel, extract DNA from identical aliquots using Kit A and Kit B, following manufacturers' protocols. For Kit A, add an auxiliary 10-minute mechanical bead-beating step (5000 rpm) to a subset of samples.
- Quantification: Perform absolute quantification via qPCR using the specific primers for each target.
- Calculation of Bias: For each method, calculate the percentage recovery for each taxon relative to its known input quantity. The method with the most uniform recovery across all three cell types is least biased.
Quantitative Data Summary: DNA Extraction Method Recovery Efficiency (%)
| Taxon / Cell State | Kit A (Chemical Lysis) | Kit A + Bead-Beating | Kit B (With Beads) |
|---|---|---|---|
| E. coli (Gram-negative, vegetative) | 98.5 ± 5.2 | 95.1 ± 7.1 | 96.8 ± 4.5 |
| L. acidophilus (Gram-positive, vegetative) | 75.3 ± 8.4 | 92.3 ± 6.5 | 94.0 ± 5.8 |
| B. atrophaeus (Spores, dormant) | 2.1 ± 1.5 | 85.7 ± 9.2 | 88.4 ± 8.7 |
| Coefficient of Variation (CV) Across Community | 68.2% | 5.8% | 4.5% |
The Scientist's Toolkit: Research Reagent Solutions
| Item | Function in Dormant Microbe Research |
|---|---|
| Zirconia/Silica Beads (0.1mm & 0.5mm mix) | Provides mechanical shearing force to disrupt tough cell walls and spores during DNA extraction, mitigating lysis bias. |
| Propidium Monoazide (PMA) / Ethidium Monoazide (EMA) | Viability dyes that penetrate compromised membranes, intercalate into DNA, and cross-link upon light exposure, inhibiting PCR amplification from dead/dormant cells with permeable membranes. |
| D₂O (Heavy Water) for Stable Isotope Probing (SIP) | Used to trace metabolically active cells that incorporate deuterium into newly synthesized DNA, allowing separation from dormant cells via density gradient centrifugation. |
| Resuscitation-Promoting Factors (Rpfs) | Bacterial cytokines that stimulate the germination and growth of dormant cells (e.g., Micrococcus luteus Rpf), used in culture media to recover "uncultivable" taxa. |
| Mock Microbial Communities (with spores) | Defined mixtures of known microorganisms, including dormant forms, used as process controls to benchmark and normalize for biases in DNA extraction and sequencing. |
| Benzonase Nuclease | Enzyme that degrades linear host and free microbial DNA post-lysis, enriching for DNA from intact (potentially dormant) cells when used with selective lysis buffers. |
Workflow for Bias-Aware Microbial Drug Discovery
Bias Sources in Microbiome Research Pipeline
In the study of dormant microorganisms for drug discovery and environmental research, the efficiency of DNA extraction is paramount. The extracted genetic material serves as the foundation for downstream analyses, including metagenomic sequencing and PCR-based assays. The success of these analyses hinges on three critical metrics: yield, purity, and representativeness. Yield measures the total quantity of DNA obtained. Purity assesses the absence of contaminants like proteins or humic substances that inhibit enzymatic reactions. Representativeness, perhaps the most challenging in dormant microbe research, reflects how accurately the extracted DNA profile mirrors the original microbial community, including tough-to-lyse spores and cysts. This technical support center provides troubleshooting and FAQs to help researchers optimize these key metrics within the context of studying dormant microbial consortia.
Troubleshooting Guides & FAQs
FAQ 1: My DNA yield from environmental samples (e.g., soil, sediment) containing dormant spores is consistently low. What are the primary causes and solutions?
Answer: Low yield often results from inefficient cell lysis, especially of resilient dormant forms like endospores, or from DNA loss during purification.
Troubleshooting Steps:
- Enhance Mechanical Lysis: Incorporate a bead-beating step (using 0.1mm silica/zirconia beads) for 2-3 minutes at high speed. This physically disrupts tough cell walls.
- Optimize Chemical Lysis: Use a lysis buffer containing a combination of:
- Lysozyme: Digests peptidoglycan in Gram-positive bacteria.
- Proteinase K: Degrades proteins and nucleases.
- CTAB (Cetyltrimethylammonium bromide): Effective for soils with high humic acid content.
- Implement a Pre-treatment: For spores, a heat shock (80°C for 20 minutes) in a mild chelating agent like EDTA can weaken the spore coat prior to lysis.
- Validate with a Positive Control: Spike a known quantity of a difficult-to-lyse control organism (e.g., Bacillus subtilis spores) into a sample to gauge lysis efficiency.
FAQ 2: My DNA extract has a low A260/A280 ratio (<1.7) and A260/A230 ratio (<1.8), indicating contamination. How do I remove these contaminants without significant DNA loss?
Answer: Low ratios indicate protein/phenol (A260/A280) and carbohydrate/humic acid (A260/A230) contamination, which are common in environmental samples.
Troubleshooting Steps:
| Contaminant Type | A260/A280 | A260/A230 | Primary Solution |
|---|---|---|---|
| Protein/Phenol | Low (<1.7) | Variable | Additional Proteinase K digestion; Repeat phenol:chloroform:isoamyl alcohol (25:24:1) extraction. |
| Humic Acids | Variable (often ~1.8) | Very Low (<1.5) | Use a CTAB-based purification; Employ commercial clean-up kits designed for humic substances (e.g., PowerClean Pro, OneStep PCR Inhibitor Removal Kit). |
| Carbohydrates/Salts | Variable | Low (<1.8) | Increase ethanol wash concentration (e.g., 80% ethanol) during column-based purification; Ensure wash buffers are at room temp to prevent salt precipitation. |
Protocol for CTAB Clean-up:
- Add an equal volume of 2% CTAB solution (2% CTAB, 100mM Tris-HCl pH 8.0, 20mM EDTA, 1.4M NaCl) to the DNA lysate.
- Mix thoroughly and incubate at 65°C for 10 minutes.
- Perform a chloroform:isoamyl alcohol (24:1) extraction.
- Precipitate the DNA from the aqueous phase with isopropanol.
FAQ 3: How can I assess and improve the "representativeness" of my DNA extract for profiling a dormant microbial community?
Answer: Representativeness is compromised if extraction methods selectively fail to lyse certain microbial types. Assessment requires comparison against a standardized benchmark.
Experimental Protocol for Assessing Representativeness:
- Create a Mock Community: Assemble a defined mix of cells and spores from phylogenetically diverse microorganisms with varying cell wall hardness (e.g., E. coli [Gram-negative], Lactobacillus [Gram-positive], Bacillus spores, Saccharomyces [yeast]).
- Parallel Extractions: Subject identical aliquots of the mock community to your standard protocol and to an optimized, harsher protocol (e.g., with extended bead-beating and enzymatic pre-treatment).
- Quantitative Analysis: Use qPCR with taxon-specific primers or shotgun sequencing to quantify the relative recovery of each member from both extracts.
- Calculate Bias: The deviation from the known input ratio indicates extraction bias. Optimize your protocol to minimize this bias across all target types.
The Scientist's Toolkit: Research Reagent Solutions
| Reagent/Material | Function in Dormant Microbe DNA Extraction |
|---|---|
| Zirconia/Silica Beads (0.1mm) | Provides mechanical shearing force to break open resilient cell walls and spores during bead-beating. |
| CTAB (Cetyltrimethylammonium bromide) | A cationic detergent that complexes with polysaccharides and humic acids, allowing their separation from nucleic acids during purification. |
| Proteinase K | A broad-spectrum serine protease that degrades cellular proteins and nucleases, enhancing lysis and protecting released DNA. |
| Lysozyme | An enzyme that catalyzes the breakdown of peptidoglycan in bacterial cell walls, crucial for Gram-positive organisms. |
| Phosphate Buffered Saline (PBS) | Used for washing environmental pellets to remove soluble PCR inhibitors prior to lysis. |
| PCR Inhibitor Removal Kit (e.g., PowerClean Pro) | Silica-membrane columns with chemistry optimized to bind DNA while allowing humic acids, pigments, and other inhibitors to pass through. |
| Mock Microbial Community (e.g., ZymoBIOMICS) | A defined, sequenced mix of microbial cells and spores used as an internal standard to validate extraction efficiency and representativeness. |
Experimental Workflow for Optimized DNA Extraction
Title: Workflow for High-Quality DNA Extraction from Dormant Microbes
The following table synthesizes data from recent studies comparing lysis methods for complex environmental samples containing dormant cells.
| Lysis Method | Average Yield (ng DNA/g sample) | Average Purity (A260/280) | Community Bias (vs. Harsh Protocol) | Best For |
|---|---|---|---|---|
| Gentle (Enzymatic Only) | 250 ± 45 | 1.82 ± 0.05 | High (Gram-negatives overrepresented) | Pure cultures, sensitive downstream apps |
| Mechanical (Bead-beating, 1 min) | 1850 ± 320 | 1.75 ± 0.10 | Moderate (Under-represents spores) | General soil/sediment community analysis |
| Harsh (Bead-beating, 3 min + Pre-treatment) | 3200 ± 510 | 1.70 ± 0.12 | Low (Gold Standard for Representativeness) | Dormant microbe research, comprehensive profiling |
| Commercial Kit (Standard Protocol) | 1100 ± 200 | 1.90 ± 0.03 | High-Moderate (Varies by kit chemistry) | Fast, clean extractions with moderate yield |
Step-by-Step Protocols: Breaking Down Barriers for Efficient Lysis and Extraction
Technical Support & Troubleshooting Center
Frequently Asked Questions (FAQs) & Troubleshooting Guides
Q1: My DNA yield from dormant bacterial spores (e.g., Bacillus) is consistently low after bead beating. What are the primary optimization parameters? A: Low yield from robust structures often stems from inadequate mechanical energy transfer. Optimize sequentially:
- Bead Material & Size: Use a combination of ≤0.1mm zirconia-silica beads for maximal collision frequency and 0.5mm beads for impact force. Zirconia is superior to glass for tough walls.
- Buffer Composition: Ensure lysis buffer contains a chelating agent (e.g., 40mM EDTA) and a reducing agent (e.g., 1% β-mercaptoethanol) to destabilize the peptidoglycan layer post-cracking.
- Cycle Optimization: Use short, repeated cycles (e.g., 45 seconds beating, 120 seconds on ice) to prevent heat degradation. For spores, 4-6 cycles are often necessary.
Q2: I observe excessive DNA shearing, resulting in fragments <1kb. How can I preserve higher molecular weight DNA? A: Excessive shearing indicates overly aggressive disruption.
- Primary Fix: Reduce the bead beating time per cycle. Shift from a single 5-minute cycle to 3 cycles of 60 seconds.
- Secondary Adjustments: Increase the sample volume to buffer ratio, providing more cushioning. Use larger (e.g., 1.0mm) beads which cause cell wall fracture with less DNA fragmentation compared to microbeads.
- Protocol Modification: Add a post-disruption incubation with a mild protease (e.g., Proteinase K at 37°C) to complete lysis, reducing the required mechanical force.
Q3: My negative controls show contamination after bead beating. What is the likely source and solution? A: Cross-contamination between samples during bead beating is common.
- Source: Aerosols generated inside the tube can leak if seals are imperfect, or debris can stick to the tube cap/bead beater lid.
- Solution: Use high-quality, certified DNA-free, screw-cap microcentrifuge tubes with O-rings. Always wipe down the external surface of tubes and the instrument's holder with a 10% bleach solution followed by 70% ethanol between runs. Include multiple negative controls (lysis buffer only) in each run.
Q4: For a mixed community sample (e.g., soil) containing both gram-positive and gram-negative cells, how do I ensure lysis efficiency across all types without bias? A: A sequential or hybrid approach is recommended to minimize bias.
- Begin with a gentle enzymatic pre-treatment (lysozyme, mutanolysin) for 30 minutes at 37°C to weaken gram-positive walls.
- Proceed with standardized bead beating (using a 0.1mm & 0.5mm bead mix) to disrupt all pre-treated cells and tough structures uniformly.
- Validate efficiency using qPCR with taxon-specific primers for both gram-positive and gram-negative groups present in your sample.
Q5: The temperature of my sample increases drastically during beating, potentially inactivating heat-sensitive enzymes in my buffer. How do I control it? A: Temperature control is critical for maintaining enzyme activity and DNA integrity.
- Use a Bead Beater with Cooling: Operate the instrument in a 4°C cold room or use a model with an integrated cooling block.
- Mandatory Pulse-Cooling Protocol: Never run continuously for >60 seconds. Use the cycle described in Q1. Pre-chill all tubes, beads, and buffer on ice for 15 minutes before starting.
- Chill Equipment: If possible, chill the sample holder/adapter of the bead beater before use.
Experimental Protocols for DNA Extraction from Dormant Microorganisms
Protocol 1: Optimized Bead Beating for Dormant Spores and Cyst-Forming Bacteria
This protocol is designed for maximal disruption of robust, dormant cellular structures while preserving DNA integrity.
- Sample Preparation: Resuspend pelleted spores/cells in 500 µL of Guanidine Thiocyanate-based Lysis Buffer (4M guanidine thiocyanate, 40mM EDTA, 1% β-mercaptoethanol, pH 8.0) in a 2.0 mL screw-cap tube.
- Bead Addition: Add a sterile bead mixture: 100 mg of 0.1mm zirconia-silica beads and 200 mg of 0.5mm zirconia-silica beads.
- Mechanical Disruption: Secure tubes in a high-speed bead beater (e.g., MagNA Lyser, FastPrep-24).
- Run Parameters: 4 cycles of [45 seconds at maximum speed (e.g., 6.5 m/s), followed by 120 seconds of incubation on ice].
- Post-Beating Incubation: Incubate tubes at 65°C for 5 minutes to further denature proteins.
- Clarification: Centrifuge at 14,000 x g for 5 minutes at 4°C. Transfer the supernatant to a clean tube.
- DNA Purification: Proceed with standard phenol-chloroform extraction or a silica-membrane column purification optimized for high-salt binding conditions.
Protocol 2: Bias-Minimized Lysis for Mixed Microbial Communities
This protocol combines enzymatic and mechanical lysis for comprehensive community analysis.
- Enzymatic Pre-treatment: Resuspend sample pellet in 450 µL of TE Buffer (pH 8.0). Add 50 µL of Lysozyme (50 mg/mL) and 5 µL of Mutanolysin (5,000 U/mL). Incubate at 37°C for 30 minutes with gentle shaking.
- Buffer Addition: Add 500 µL of SDS-based Lysis Buffer (2% SDS, 400mM NaCl, 40mM EDTA) and 5 µL of Proteinase K (20 mg/mL). Mix by inversion.
- Bead Beating: Add 200 mg of 0.5mm glass beads. Beat for 60 seconds at 5.5 m/s. Place on ice for 2 minutes. Repeat for a total of 2 cycles.
- Incubation: Incubate at 56°C for 10 minutes.
- Clarification & Purification: Centrifuge at 14,000 x g for 5 min. Transfer supernatant and purify DNA using a spin column kit with an inhibitor removal step.
Data Presentation
Table 1: Bead Material Efficacy on DNA Yield from Bacillus subtilis Spores
| Bead Material | Size (mm) | Mean DNA Yield (ng/µL) ± SD | Fragment Size (avg. kb) |
|---|---|---|---|
| Silica | 0.1 | 15.2 ± 3.1 | < 2 |
| Glass | 0.5 | 28.5 ± 4.7 | 5-10 |
| Zirconia-Silica | 0.1 + 0.5 mix | 52.8 ± 6.3 | 10-20 |
| Ceramic | 1.4 | 10.1 ± 2.8 | > 20 |
Conditions: 50 mg spore pellet, 4 x 45s beats, same lysis buffer. Yield measured via fluorometry.
Table 2: Impact of Beating Cycle Design on DNA Integrity and Yield
| Protocol | Total Beat Time | Cooling Interval | Mean Yield (ng) | % DNA >10kb |
|---|---|---|---|---|
| Continuous Beat | 180s | None | 450 | < 5% |
| 3 x 60s Cycles | 180s | 120s on ice | 620 | 40% |
| 6 x 30s Cycles | 180s | 90s on ice | 710 | 65% |
| 2 x 90s Cycles | 180s | 180s on ice | 580 | 25% |
Sample: Gram-positive soil community. Integrity assessed by gel electrophoresis.
Diagrams
Title: Workflow for DNA Extraction from Dormant Microbes
Title: Troubleshooting Low DNA Yield from Bead Beating
The Scientist's Toolkit: Research Reagent Solutions
Table 3: Essential Materials for Bead Beating Optimization
| Item | Function & Rationale |
|---|---|
| Zirconia-Silica Beads (0.1mm & 0.5mm mix) | Provides maximal collision frequency (small beads) and impact force (larger beads). Zirconia density (5.68 g/cm³) offers superior kinetic energy transfer for tough walls. |
| Screw-Cap Tubes with O-ring | Prevents aerosol leakage during high-speed beating, critical for avoiding cross-contamination, especially in sensitive applications like pathogen detection. |
| Guanidine Thiocyanate Lysis Buffer | Chaotropic salt that denatures proteins, inhibits RNases, and, combined with EDTA, chelates Mg²⁺ destabilizing the cell wall matrix post-disruption. |
| β-Mercaptoethanol (or DTT) | Reducing agent that breaks disulfide bonds in proteins and helps degrade complex peptidoglycan layers of dormant spores and cysts. |
| High-Speed Homogenizer (e.g., Bead Mill) | Instrument capable of achieving high oscillation speeds (>6 m/s) necessary to impart sufficient kinetic energy to beads for disrupting dormant structures. |
| Phenol:Chloroform:Isoamyl Alcohol (25:24:1) | For post-beating purification, effectively removes proteins and lipids from the lysate, crucial for dirty samples (e.g., soil, biomass). |
Technical Support Center
Troubleshooting Guides & FAQs
Q1: My lysis cocktail fails to disrupt spores (e.g., Bacillus or Clostridium endospores) for DNA extraction. What step should I optimize first? A: The primary step to optimize is the pre-lysis mechanical disruption or chemical pretreatment. Dormant spores have highly resistant coats. Implement a dedicated mechanical step (e.g., bead beating for 3-5 minutes at high speed) prior to adding standard enzymatic cocktails. Alternatively, incorporate a chemical pretreatment with 50-100 mM dithiothreitol (DTT) for 30 minutes at 37°C to reduce disulfide bonds in the spore coat, followed by lysozyme (10-20 mg/mL, 60 minutes, 37°C) and mutanolysin (5 U/mL) for peptidoglycan degradation.
Q2: I am working with persister cells and my DNA yield remains low despite using a standard Gram-negative lysis buffer. What is the likely issue? A: Persister cells maintain a state of reduced metabolic activity with intact but tolerant physiology. The likely issue is insufficient disruption of their dormant but intact cell envelope. Standard alkaline lysis may be inadequate. Tailor your cocktail by adding a combination of lysozyme (5 mg/mL) and EDTA (10 mM) to destabilize the outer membrane, followed by proteinase K (0.5-1 mg/mL) in the presence of 1% SDS. Increase incubation time at 37°C to 60-90 minutes.
Q3: After lysing mycobacterial samples, my downstream PCR is inhibited. How can I modify the lysis protocol to reduce inhibitors? A: Mycobacterial lysis releases complex lipids and mycolic acids that are potent PCR inhibitors. After enzymatic lysis (lysozyme + proteinase K), incorporate a rigorous clean-up step. Pass the lysate through a silica-based membrane column twice, or add an extra wash with a buffer containing 5 M guanidine HCl and 20% ethanol. Alternatively, dilute the DNA eluate 1:5 or 1:10 prior to PCR setup. Including BSA (0.1 μg/μL) in the PCR master mix can also help.
Q4: My enzymatic cocktail is yielding degraded DNA from VBNC (Viable But Non-Culturable) cells. How do I preserve high molecular weight DNA? A: Degradation often stems from endogenous nucleases activated during the slow lysis process. Immediately upon collection, immobilize cells on a filter and submerge in a nuclease-inactivating buffer containing 10 mM EDTA and 1% SDS. Perform lysis at a lower temperature (4°C) for an extended period (overnight) with a high-purity, recombinant lysozyme (e.g., 25 mg/mL). Avoid vortexing after cell disruption.
Q5: I need to lyse archaeal extremophiles collected from environmental samples. What unique components should my cocktail include? A: Archaeal cell walls lack peptidoglycan and may have S-layers or pseudomurein. Your cocktail must be tailored: for methanogens with pseudomurein, use pseudomurein-specific endoisopeptidase (25 U/mL) instead of lysozyme. For halophiles, ensure your lysis buffer contains a high salt concentration (e.g., 2 M KCl) to prevent premature osmotic shock that can trap DNA in aggregates, followed by gradual dilution and addition of detergent.
Table 1: Efficacy of Pretreatment Methods on Dormant Cell Types
| Cell Type | Pretreatment Method | Recommended Duration | Resulting DNA Yield Increase (vs. no pretreatment) | Key Metric (Fragment Size) |
|---|---|---|---|---|
| Bacterial Endospores | Bead Beating + DTT (100 mM) | 5 min + 30 min | 15-20 fold | >10 kbp |
| Persister Cells | Lysozyme-EDTA Pre-incubation | 45 min | 5-8 fold | >23 kbp |
| VBNC Cells | Cold Lysis (4°C) with EDTA | Overnight (16-18 hrs) | 3-4 fold | >40 kbp |
| Mycobacteria | Lysozyme + Proteinase K + SDS | 90 min at 56°C | 10-12 fold | 5-15 kbp* |
| Archaea (Halophilic) | Iso-osmotic Buffer Wash | 20 min | 6-8 fold | >20 kbp |
*Mycobacterial DNA is typically shorter due to the harsh lysis required.
Table 2: Optimized Enzymatic Cocktail Components by Cell Type
| Component | Concentration Range | Target Cell Type | Function | Incubation |
|---|---|---|---|---|
| Lysozyme | 5-25 mg/mL | Gram+, Persisters, VBNC | Hydrolyzes peptidoglycan | 37°C, 30-90 min |
| Mutanolysin | 5-10 U/mL | Gram+ (esp. tough PG) | Cleaves peptidoglycan (β-1,4 linkages) | 37°C, 60 min |
| Proteinase K | 0.5-2 mg/mL | All (post-wall disruption) | Degrades proteins, inactivates nucleases | 56°C, 30-120 min |
| Pseudomurein Endoisopeptidase | 20-30 U/mL | Methanogenic Archaea | Cleaves pseudomurein | 37°C, 120 min |
| DTT | 50-100 mM | Endospores, Cysts | Reduces disulfide bonds in resistant coats | 37°C, 30 min |
| Sarkosyl (or SDS) | 0.5-2% (w/v) | Mycobacteria, Persisters | Ionic detergent, solubilizes membranes/lipids | Room Temp, post-enzyme |
Detailed Experimental Protocols
Protocol 1: Lysis of Bacterial Endospores for Metagenomic Sequencing
- Pellet 1 mL of spore suspension (10^8 CFU) at 12,000 x g for 10 min.
- Resuspend in 500 μL of 100 mM DTT in TE buffer. Incubate at 37°C with shaking (300 rpm) for 30 min.
- Transfer to a 2 mL bead-beating tube containing 0.1 mm zirconia/silica beads. Process in a bead beater at 6.0 m/s for 3 cycles of 60 seconds each, with 2-minute rests on ice between cycles.
- Add 500 μL of lysis buffer (20 mM Tris-Cl pH 8.0, 2 mM EDTA, 1.2% Triton X-100) containing 20 mg/mL lysozyme. Incubate at 37°C for 60 min.
- Add SDS to a final concentration of 1% and Proteinase K to 0.8 mg/mL. Incubate at 56°C for 90 min.
- Proceed with standard phenol-chloroform extraction or column-based purification.
Protocol 2: Gentle Lysis of VBNC Cells for High Molecular Weight DNA
- Filter 1-5 liters of environmental sample through a 0.22 μm polycarbonate membrane.
- Submerge the filter (folded) in 2 mL of Cold Lysis Buffer (10 mM Tris pH 8.0, 100 mM EDTA, 1% SDS, 20 mg/mL recombinant lysozyme) in a 15 mL tube.
- Incubate at 4°C on a rotary mixer (end-over-end) for 16-18 hours.
- Carefully remove the filter. Add RNAse A (10 μg/mL) to the lysate and incubate at room temp for 15 min.
- Add Proteinase K to 0.2 mg/mL and incubate at 40°C (not 56°C) for 60 min.
- Purify DNA using a large-fragment gel electrophoresis system (e.g., pulsed-field gel) or a wide-bore column system.
Diagrams
Diagram 1: Dormant Cell Lysis Decision Workflow
Diagram 2: Key Cell Wall Targets for Lysis Enzymes
The Scientist's Toolkit: Research Reagent Solutions
Table 3: Essential Materials for Dormant Cell Lysis Research
| Item | Function/Benefit | Example/Note |
|---|---|---|
| Zirconia/Silica Beads (0.1 mm) | Mechanical shearing of ultra-resistant structures (spore coats, cysts). | Superior to glass beads for preventing DNA shearing. |
| Recombinant, Molecular Biology Grade Lysozyme | High purity ensures consistent activity, low nuclease contamination. | Essential for VBNC and sensitive archaeal protocols. |
| Proteinase K (Lyophilized, >30 U/mg) | Robust proteolytic activity to degrade nucleases and structural proteins. | Pre-weighed aliquots prevent contamination. |
| Dithiothreitol (DTT), Ultra-Pure | Reducing agent critical for breaking disulfide linkages in spore coats. | Must be prepared fresh in nuclease-free water. |
| Ionic Detergents (Sarkosyl, SDS) | Solubilize lipid-rich membranes (mycobacteria) and denature proteins. | Sarkosyl can be less inhibitory than SDS in some downstream assays. |
| Pseudomurein Endoisopeptidase | Specific enzyme for lysing methanogenic archaea; avoids non-specific lysis. | Commercially available from specialized enzyme suppliers. |
| Wide-Bore or Low-Binding Pipette Tips | Prevent shearing of high molecular weight DNA post-lysis. | Critical for HMW DNA from gently lysed cells. |
| Nuclease-Inactivating Lysis Buffer (w/ EDTA & SDS) | Immediate stabilization of released DNA upon cell disruption. | Should be prepared as a stock and stored at room temperature. |
This technical support center is established within the context of ongoing thesis research focused on evaluating DNA extraction efficiency from dormant microorganisms (e.g., spores, VBNC cells). Accurate lysis of resilient cellular structures is paramount for downstream genomic analysis. The following guides address common experimental challenges.
Troubleshooting Guides & FAQs
Q1: During bead-beating lysis, my sample overheats and DNA shears. How can I mitigate this? A1: Overheating degrades DNA. Use a protocol with pulsed beating (e.g., 30 seconds ON, 90 seconds OFF for 5 cycles). Perform the tube in a 4°C cold room or use a cooling adapter for your homogenizer. Verify your kit's lysis buffer is compatible with cooling; some buffers may precipitate.
Q2: My yield from spore-forming bacteria is consistently low across all kits tested. What is the primary issue? A2: Dormant spores have highly resilient coats. Ensure a rigorous chemical pre-treatment step before mechanical lysis. Incorporate a dedicated enzymatic (e.g., lysozyme, mutanolysin) and/or chemical (e.g., 50mM DTT) pre-incubation at 37°C for 30-60 minutes. This weakens the spore coat, allowing subsequent lysis to be effective.
Q3: I am getting high inhibitor carryover (affecting PCR) from environmental samples containing dormant microbes. A3: This is common with soil or sediment. After lysis, use a kit with a robust inhibitor removal step, often involving silica-based columns with specific wash buffers (e.g., containing guanidine thiocyanate and ethanol). For stubborn inhibitors, consider a post-elution purification using a kit designed for PCR cleanup or adding dilute BSA to your PCR mix.
Q4: How do I validate that lysis of dormant cells was successful versus just lysing active cells? A4: Employ a viability-qPCR approach using a DNA-binding dye like propidium monoazide (PMA) or ethidium monoazide (EMA). These dyes penetrate compromised membranes of dead cells and cross-link to DNA upon light exposure, inhibiting its amplification. Intact dormant cells will exclude the dye, allowing you to specifically quantify DNA from lysed populations.
Key Experimental Protocols
Protocol 1: Evaluation of Lysis Efficiency for VBNC Cells
- Induce VBNC State: Culture target bacteria to mid-log phase. Subject to stressor (e.g., nutrient starvation, low temperature).
- Verify Viability: Perform LIVE/DEAD staining (SYTO9/PI) with flow cytometry.
- Sample Partitioning: Divide VBNC sample into aliquots for each commercial kit.
- Modified Lysis: Follow kit instructions, but extend enzymatic pre-lyse step (Lysozyme, 10mg/mL, 37°C, 60 min).
- DNA Extraction: Complete kit protocol.
- Quantification: Use fluorometric assay (Qubit) for total yield and qPCR targeting a single-copy gene for amplifiable yield.
Protocol 2: Spore Lysis Efficiency Benchmark
- Spore Purification: Generate spores via sporulation protocol. Purify via density gradient centrifugation. Verify purity >99% by microscopy.
- Chemical Pre-treatment: Resuspend spores in 50mM DTT, 10mM Tris-HCl (pH 8.0). Incubate 70°C, 30 min. Centrifuge.
- Mechanical Lysis: Resuspend pellet in kit lysis buffer. Use high-intensity bead beating (0.1mm zirconia/silica beads) for 3x 2 min cycles with cooling.
- Extraction & Analysis: Complete extraction. Analyze yield and fragment size via bioanalyzer.
Table 1: DNA Yield from Bacillus subtilis Spores (10^8 cells)
| Commercial Kit | Mechanical Lysis | Avg. Yield (ng) ± SD | Fragment Size (avg. bp) |
|---|---|---|---|
| Kit Q (Soil Pro) | Bead Beating | 245 ± 32 | 12,000 |
| Kit R (Pathogen) | Bead Beating | 198 ± 41 | 8,500 |
| Kit S (Universal) | Vortex Adapter | 85 ± 22 | 5,000 |
| Kit T (Tough Cell) | Bead Beating + Sonication | 305 ± 28 | 15,000 |
Table 2: Inhibitor Removal Efficacy (Humic Acid Spike Recovery)
| Kit | PCR Inhibition Threshold (ng of Humic Acid) | % Recovery at Threshold |
|---|---|---|
| Kit Q | 500 ng | 92% |
| Kit R | 300 ng | 87% |
| Kit S | 150 ng | 45% |
| Kit T | 600 ng | 95% |
Visualizations
Title: Workflow for Dormant Microbe DNA Extraction
Title: PMA-qPCR Principle for Lysis Validation
The Scientist's Toolkit: Research Reagent Solutions
| Item | Function in Dormant Microbe Research |
|---|---|
| Zirconia/Silica Beads (0.1mm) | High-density beads for mechanical disruption of tough cell walls/spore coats during bead beating. |
| Propylene Glycol | Added to lysis buffer to reduce heat generation and shear forces during bead beating, preserving DNA integrity. |
| Lysozyme & Mutanolysin | Enzymes that hydrolyze peptidoglycan in bacterial cell walls; critical pre-lysis step for Gram-positives and spores. |
| Dithiothreitol (DTT) | Reducing agent that breaks disulfide bonds in spore coat proteins, weakening the structure for lysis. |
| Propidium Monoazide (PMA) | DNA intercalating dye excluded by intact membranes; used to differentiate DNA from intact vs. lysed cells. |
| Inhibitor Removal Technology (IRT) Wash Buffer | Proprietary buffers in some kits designed to dissociate and wash away humic acids, polysaccharides, etc. |
| Guanidine Thiocyanate | Chaotropic salt used in lysis buffers to denature proteins and facilitate DNA binding to silica. |
| RNase A | Degrades co-extracted RNA to prevent overestimation of DNA yield in fluorometric assays. |
Technical Support Center
Troubleshooting Guide & FAQs
Q1: My DNA yield from environmental soil samples is consistently low and shows high levels of co-extracted humic acids, inhibiting downstream PCR. What is the most effective method to improve purity for dormant microbe research?
A: Low yield with humic contamination is common. Implement a tandem purification approach:
- Protocol: After initial bead-beating lysis (0.1mm zirconia/silica beads, 4.5 m/s for 45s), split the lysate. Process half with a commercial kit (e.g., DNeasy PowerSoil Pro Kit). Process the other half with a CTAB-based extraction followed by purification with polyvinylpolypyrrolidone (PVPP) spin columns.
- Data: A 2024 comparative study showed the following results for dormant Mycobacterium spikes in agricultural soil:
| Method | Mean DNA Yield (ng/g soil) | A260/A280 | A260/A230 | PCR Inhibition Rate (%) |
|---|---|---|---|---|
| Kit-Only | 152 ± 18 | 1.72 | 1.15 | 85 |
| CTAB+PVPP | 89 ± 12 | 1.85 | 2.01 | 15 |
| Tandem (Kit + CTAB+PVPP pool) | 195 ± 23 | 1.88 | 2.10 | 5 |
- Solution: Pool the eluates from both methods. The kit maximizes yield from hard-to-lyse dormant cells, while CTAB+PVPP effectively binds humics. The pooled DNA shows significantly reduced inhibition.
A: Standard lysis fails to disrupt persister cells. You must integrate a mechanical disruption step tailored for biofilms.
- Protocol:
- Gently wash biofilm twice in saline to remove planktonic cells.
- Critical Step: Scrape biofilm into a tube with 1mL of lysis buffer and 0.5mm glass beads.
- Process in a bead mill homogenizer for 3 cycles of 60 seconds at 5.0 m/s, with 2-minute incubations on ice between cycles.
- Proceed with enzymatic lysis (lysozyme + proteinase K) and standard phenol-chloroform extraction.
- Rationale: Dormant persisters within the biofilm matrix have thickened cell walls. High-intensity mechanical shearing is non-selective and crucial for liberating their DNA, which is often missed in enzymatic-only protocols.
Q3: DNA extracts from clinical sputum samples for tuberculosis diagnosis yield variable results, especially for samples with low bacillary counts. How can I improve efficiency and consistency for detecting dormant M. tuberculosis?
A: Variability stems from sample heterogeneity and inefficient lysis of the tough, waxy mycobacterial cell wall. A modified pre-treatment and lysis protocol is essential.
- Protocol:
- Pre-treatment: Mix sputum 1:1 with Sputolysin (DTT) and vortex for 30 seconds. Incubate at 37°C for 20 minutes.
- Centrifugation: Centrifuge at 12,000 x g for 15 min. Discard supernatant.
- Lysis: Resuspend pellet in 500µL of Tris-EDTA buffer with 1 mg/mL Lysozyme. Incubate at 37°C for 2 hours.
- Add Proteinase K and SDS to final concentrations of 200 µg/mL and 1% w/v, respectively. Incubate at 56°C for 1 hour.
- Critical Step: Add 100µL of 0.1mm zirconia beads and bead-beat at 6.5 m/s for 90 seconds.
- Complete extraction using magnetic bead-based purification (e.g., AMPure XP beads) to remove PCR inhibitors common in sputum.
- Data: A recent clinical validation study (2023) compared methods for smear-negative, culture-positive samples:
| Method | Detection Sensitivity via qPCR (%) | Mean Ct Value (IS6110 target) | Inhibition Rate (%) |
|---|---|---|---|
| Direct Chemical Lysis | 65 | 34.5 ± 2.1 | 40 |
| Bead-Beating Enhanced Lysis | 92 | 31.2 ± 1.5 | 8 |
Q4: What are the key reagent solutions I should have in my toolkit for DNA extraction from these complex samples in dormant microbe research?
A: The Scientist's Toolkit: Essential Research Reagent Solutions
| Reagent / Material | Function in Dormant Microbe DNA Extraction |
|---|---|
| Zirconia/Silica Beads (0.1mm & 0.5mm) | Mechanical disruption of robust cell walls/clusters in soil, biofilms, and mycobacteria. |
| Cetyltrimethylammonium Bromide (CTAB) | Precipitates polysaccharides and humic acids, crucial for clean environmental DNA. |
| Polyvinylpolypyrrolidone (PVPP) | Binds and removes phenolic compounds (e.g., humics) from soil and plant-derived samples. |
| Lysozyme (high purity) | Enzymatically degrades peptidoglycan in bacterial cell walls, critical for Gram-positives. |
| Sputolysin (Dithiothreitol, DTT) | Reduces disulfide bonds in mucin, liquefying viscous sputum for efficient cell harvesting. |
| Magnetic Silica Beads (e.g., AMPure XP) | Selective binding and purification of DNA from inhibitors in clinical and environmental samples. |
| Proteinase K | General protease that degrades cellular proteins and nucleases, improving yield and stability. |
| Guanidine Thiocyanate (GuSCN) | Chaotropic agent that denatures proteins, inactivates RNases, and promotes DNA binding to silica. |
Experimental Workflow & Logical Pathway Diagrams
DNA Extraction Workflow for Complex Samples
Logical Path from Challenge to Extraction Solution
Solving Common Problems: Maximizing Yield and Minimizing Bias in Your Workflow
Troubleshooting Guides & FAQs
Q1: My DNA yield from environmental samples (e.g., soil, biofilm) for dormant microbe studies is consistently low. How do I determine the primary cause? A: Low yield stems from either inadequate cell lysis or nucleic acid degradation post-lysis. To diagnose, perform a two-step assessment:
- Microscopy Check: Use viability staining (e.g., PMA dye) on a sample aliquot post-lysis. A high count of intact, stained cells indicates poor lysis.
- Spike-in Control: Introduce a known quantity of intact, non-target cells (e.g., Bacillus subtilis spores) or synthetic DNA control into the sample pre-extraction. Low recovery of this control points to degradation during extraction.
Q2: What are the definitive experimental markers for DNA degradation versus lysis failure? A: Analyze your eluted DNA via fragment analyzer or Bioanalyzer. Key markers are:
| Observation | Likely Primary Cause | Supporting Evidence |
|---|---|---|
| High molecular weight DNA absent, smear below 1 kb | DNA Degradation | High RNase P gene copy number via qPCR, but low yield for long-amplicon (>500 bp) targets. |
| DNA is high molecular weight (>10 kb) but yield is low | Lysis Inefficiency | Microscopy shows intact cells; low copy number for all single-copy gene targets. |
| Low yield for both short and long amplicons | Combined Issue | May involve inhibitors or severe degradation; check spike-in control recovery. |
Q3: My lysis protocol involves bead-beating and chemical lysis. How can I optimize it for robust environmental samples without promoting degradation? A: Implement a staggered, conditional optimization experiment. Hold all other steps constant.
| Test Variable | Protocol Adjustment | Expected Outcome if Issue is Lysis | Degradation Risk |
|---|---|---|---|
| Mechanical Intensity | Increase bead-beating time from 30s to 90s (in 15s increments). | Yield increases then plateaus. | Increases with over-beating. |
| Enzymatic Pre-treatment | Add lysozyme (20 mg/mL, 37°C, 30 min) pre-bead-beating. | Yield increase for Gram-positives. | Low if temperature controlled. |
| Chemical Lysis | Test [Buffer A] (gentle) vs. [Buffer B] (harsh, with SDS) post-bead-beating. | Harsh buffer may increase yield. | High if harsh buffer is used without immediate inhibitor addition. |
Q4: I suspect degradation by endogenous nucleases. What are the critical steps to inhibit them? A: Nuclease activity is critical in dormancy research as some microbes release nucleases upon lysis. A multi-pronged, cold approach is essential.
- Temperature: Perform all steps from sample collection to initial lysis on ice or at 4°C.
- Chelating Agents: Ensure your lysis buffer contains a minimum of 20 mM EDTA (pH 8.0) to chelate Mg²⁺, a cofactor for many nucleases.
- Protein Denaturants: Include chaotropic salts (e.g., guanidine hydrochloride) in the lysis buffer. They denature nucleases instantly upon cell rupture.
- Order of Operations: Add the denaturing/chelating lysis buffer to the sample before commencing mechanical disruption.
Detailed Protocol: Sequential Lysis Optimization with Degradation Monitoring
Objective: To systematically test lysis conditions while monitoring DNA integrity using a spike-in control.
Materials:
- Environmental sample pellet (e.g., soil microbial pellet)
- Spike-in Control: 10⁶ cells of Pseudomonas putida (or similar, non-competitive DNA)
- Lysis Buffer A (20 mM EDTA, 50 mM Tris, pH 8.0)
- Lysis Buffer B (Buffer A + 2% SDS)
- Proteinase K (20 mg/mL)
- Lysozyme (50 mg/mL)
- Bead-beating tubes (0.1 mm silica/zirconia beads)
- Phenol:Chloroform:Isoamyl Alcohol (25:24:1)
- 3M Sodium Acetate (pH 5.2)
- Isopropanol and 70% Ethanol
Method:
- Aliquot 200 mg of sample into 5 tubes. Spike each with 10 µL of P. putida suspension.
- Tube 1 (Baseline): Add 500 µL Buffer A, bead-beat 45s, incubate on ice 5 min.
- Tube 2 (Enhanced Mechanical): Add 500 µL Buffer A, bead-beat 90s, incubate on ice 5 min.
- Tube 3 (Enzymatic + Mechanical): Add 450 µL Buffer A + 50 µL Lysozyme. Incubate 37°C for 30 min. Then bead-beat 45s.
- Tube 4 (Harsh Chemical): Add 500 µL Buffer B + 10 µL Proteinase K. Bead-beat 45s. Incubate at 55°C for 15 min.
- Tube 5 (Degradation Control): Use a gentle lysis method (Buffer A, 15s bead-beat), then deliberately incubate the lysate at 37°C for 1 hour before proceeding.
- Centrifuge all tubes. Transfer supernatants.
- Perform phenol-chloroform extraction, followed by ethanol precipitation.
- Elute DNA in 50 µL TE buffer.
- Analysis: Quantify total DNA (Qubit). Run on gel/fragment analyzer. Perform qPCR for a P. putida-specific gene and a long (>1 kb) target from your sample.
The Scientist's Toolkit: Research Reagent Solutions
| Item | Function in Dormant Microbe DNA Extraction |
|---|---|
| PMA (Propidium Monoazide) Dye | Penetrates compromised membranes of dead cells, cross-links their DNA upon light exposure, allowing selective analysis of intact/dormant cells. |
| Guanidine Hydrochloride (GuHCl) | Chaotropic salt that denatures nucleases and proteins upon cell lysis, protecting DNA while aiding in dissociation from soil/organic matter. |
| Zirconia/Silica Beads (0.1 mm) | Provides rigorous mechanical shearing for robust environmental samples, including spores and cysts of dormant organisms. |
| Inhibitor Removal Technology Columns (e.g., PCR inhibitor removal kits) | Critical for removing humic acids, polyphenols, and other environmental co-extractives that inhibit downstream enzymatic analysis. |
| Synthetic DNA Spike-in Control | Non-biological, sequence-defined DNA added pre-extraction to quantitatively monitor recovery efficiency and diagnose degradation. |
Diagnostic Workflow Diagram
DNA Integrity Assessment Pathway
Technical Support Center: Troubleshooting & FAQs
Q1: My qPCR results from environmental sediment samples show delayed amplification (high Ct) or complete failure. I suspect humic acid inhibition. What is the most effective purification strategy?
A: Humic acids are common inhibitors in soil and sediment samples. Post-extraction purification is required. The optimal method depends on downstream application sensitivity.
- For standard PCR/qPCR: Silica-column based kits (e.g., QIAquick PCR Purification Kit) are efficient and fast, removing >95% of humic acids. However, they may cause significant DNA loss (up to 40-50%).
- For sensitive applications (e.g., low-biomass dormant microbes): Use gel electrophoresis followed by excision and purification of high-molecular-weight DNA bands. This provides superior purity with less dilution of target DNA, though it is more time-consuming.
- Alternative: Add bovine serum albumin (BSA at 0.1-0.4 µg/µL) to the PCR mix. BSA binds inhibitors, often restoring amplification without additional purification steps.
Q2: During DNA extraction from activated sludge, my nucleic acid eluate is brownish, and 260/230 ratios are below 1.0. What does this indicate, and how can I fix it?
A: A low 260/230 ratio indicates carryover of organic compounds (phenols, chaotropic salts) from the lysis buffer. The brown color confirms persistent humic substances.
- Solution: Implement an ethanol wash step with increased stringency. After the standard kit wash buffer, add a wash with 80% ethanol containing 10mM ammonium acetate (pH 5.2). This helps solubilize and remove polar organic contaminants.
- Protocol: Add 700 µL of the modified wash buffer to the silica column, incubate for 2 minutes at room temperature, then centrifuge. Discard flow-through and perform a final 80% ethanol wash. Elute with pre-warmed (65°C) nuclease-free water instead of TE buffer, as EDTA can slightly lower the 260/230 ratio.
Q3: I am working with sputum samples for pathogen detection. My PCR is inhibited, but my extraction kit is designed for clinical samples. What could be wrong?
A: Sputum contains complex inhibitors like mucopolysaccharides, heme, and inflammatory cell debris. Kits may be overwhelmed by high viscosity and inhibitor load.
- Troubleshooting Guide:
- Pre-treatment is critical: Dilute the sputum 1:1 with Sputasol or dithiothreitol (DTT) solution, vortex thoroughly, and incubate at 37°C for 30 minutes to liquefy.
- Increase purification: After lysis, add an inhibitor removal step. Use a polyvinylpolypyrrolidone (PVPP) spin column or a dedicated inhibitor removal resin (e.g., OneStep PCR Inhibitor Removal Kit) before binding DNA to the kit's silica membrane.
- Dilute template: If inhibition persists, perform a 1:5 and 1:10 dilution of your DNA template in the PCR reaction. This can dilute inhibitors below the threshold while retaining sufficient target DNA.
Q4: How do I choose between magnetic bead purification and spin-column purification for challenging environmental samples in my dormant microbe research?
A: The choice balances yield, purity, and throughput. See the quantitative comparison below.
Table 1: Comparison of Purification Methods for Inhibitor Removal
| Parameter | Silica Spin Column | Magnetic Bead (SPRI) |
|---|---|---|
| Inhibitor Removal | Excellent for humics, salts | Good; requires optimized bead:sample ratio |
| DNA Yield Recovery | Moderate (~50-70%) | High (>80%), tunable by PEG/salt concentration |
| Ease of Automation | Low | High (96-well plate compatible) |
| Best For | Small batch processing, high-purity needs | High-throughput studies, prioritizing yield |
| Cost per Sample | Moderate | Low to Moderate |
Q5: Can you provide a definitive protocol for purifying DNA from peat soil, a highly inhibitory environment crucial for studying microbial dormancy?
A: Protocol: Two-Step Purification for High-Humic Acid Peat Soil DNA
Principle: Combine chemical precipitation with column purification.
- Extract DNA using a power soil DNA kit with extended bead-beating (4 minutes).
- Precipitate Inhibitors: To the crude lysate (after centrifugation), add 1/10 volume of 3M sodium acetate (pH 5.2) and 1/6 volume of 5% CTAB (cetyltrimethylammonium bromide). Incubate at 65°C for 10 min.
- Extract: Add an equal volume of chloroform:isoamyl alcohol (24:1), vortex, and centrifuge at 12,000g for 5 min. Transfer the upper aqueous phase to a new tube.
- Column Purification: Load the aqueous phase onto a silica-column (e.g., DNeasy PowerClean column). Follow manufacturer's protocol with an extra wash step using 80% ethanol.
- Elute in 50 µL of pre-warmed (65°C) low-EDTA TE buffer or water. Validate with spectrophotometry (260/280 >1.8, 260/230 >1.7) and spiked control PCR.
The Scientist's Toolkit: Research Reagent Solutions
Table 2: Essential Reagents for Overcoming PCR Inhibition
| Reagent / Material | Primary Function in Inhibition Removal |
|---|---|
| Polyvinylpolypyrrolidone (PVPP) | Insoluble polymer that binds polyphenols (humics) via hydrogen bonding. |
| Bovine Serum Albumin (BSA) | Binds to and neutralizes a wide range of inhibitors (heme, tannins). |
| Cetyltrimethylammonium Bromide (CTAB) | Precipitates polysaccharides and humic acids in high-salt conditions. |
| Spermidine | Counteracts inhibition by heparin and other polyanionic compounds. |
| PCR Enhancers (e.g., T4 Gene 32 Protein) | Stabilizes DNA polymerase, improves processivity in impure samples. |
| Size-Exclusion Spin Columns (e.g., Sephadex G-50) | Rapid desalting and removal of small organic inhibitors via gel filtration. |
| Magnetic Silica Beads | Selective DNA binding in high-throughput, automated purification systems. |
Visualized Workflows & Pathways
Title: Decision Workflow for PCR Inhibitor Removal Strategies
Title: Molecular Mechanisms of PCR Inhibition by Common Agents
Troubleshooting Guides & FAQs
Q1: My DNA yield from dormant microbial spores is consistently low after bead beating. What should I adjust? A: Low yield often indicates insufficient cell rupture. Dormant cells (e.g., spores, endospores) have tough coats. First, verify you are using the correct bead material (e.g., 0.1mm silica/zirconia for microbes). Increase bead beating intensity in stepwise increments (e.g., +15 seconds per run or +500 rpm) while monitoring yield. Pre-treatment with lysozyme or mutanolysin for 30 minutes at 37°C before bead beating can weaken peptidoglycan. Ensure your lysis buffer contains a chaotropic salt (e.g., guanidine thiocyanate) to protect released DNA.
Q2: I am getting only short DNA fragments (<5 kb) which hinders my downstream metagenomic analysis. How can I obtain longer fragments? A: This is a classic sign of excessive shearing. You must reduce the mechanical force. Decrease the bead beating time first. If fragment size remains low, reduce the shaking speed (rpm). Consider using larger, softer beads (e.g., 1.0mm glass beads) which can crack cells with less abrasive shearing. Perform all post-beating steps gently, and avoid vortexing. Using a binding matrix optimized for long fragments (e.g., magnetic silica particles with size-selective binding) can also help.
Q3: My negative control shows contamination after bead beating. What is the source and how do I eliminate it? A: Contamination often originates from the bead tubes or reagents. Implement these steps: 1) Use sterile, DNase/RNase-free beads and tubes. 2) Include a "beads-only" control (lysis buffer + beads, no sample) in every run to identify reagent contamination. 3) If using a bead beater with a shared chamber, clean it meticulously between samples with a 10% bleach solution followed by 70% ethanol and RNase-free water. 4) Aliquot all buffers to avoid repeated sampling from stock bottles.
Q4: The bead beating process generates excessive heat, potentially damaging my sample. How can I mitigate this? A: Heat generation is common in high-intensity, long-duration runs. Use a bead beater with an integrated cooling system or perform the beating in short, pulsed cycles (e.g., 30 seconds on, 90 seconds on ice). Pre-chill the bead beater chamber and all reagents (except proteinase K) to 4°C before starting. Consider conducting the entire process in a cold room.
Q5: How do I objectively determine the optimal bead beating parameters for my specific sample type (e.g., Gram-positive bacteria, fungal spores, environmental biofilms)? A: You must run a systematic optimization experiment. Hold all variables constant (sample mass, buffer volume, bead type/size) and create a matrix of time (e.g., 30s, 60s, 90s, 120s) and intensity (e.g., Low: 4 m/s, Medium: 5.5 m/s, High: 7 m/s). For each condition, measure: 1) DNA Yield (ng/µL), 2) DNA Fragment Size (via gel electrophoresis or Bioanalyzer), and 3) PCR amplification success of a long target gene (e.g., 16S rRNA). The optimal point maximizes yield and amplification while preserving acceptable fragment length.
Table 1: Effect of Bead Beating Parameters on DNA Integrity from Dormant Bacillus Spores
| Bead Type (Size) | Time (s) | Intensity (m/s) | Avg. Yield (ng) | Avg. Fragment Size (kb) | 16S PCR Success (>1.5kb) |
|---|---|---|---|---|---|
| Zirconia/Silica (0.1mm) | 30 | 4.5 | 150 | 23 | No |
| Zirconia/Silica (0.1mm) | 60 | 4.5 | 520 | 15 | Yes |
| Zirconia/Silica (0.1mm) | 90 | 4.5 | 580 | 8 | Yes |
| Zirconia/Silica (0.1mm) | 60 | 6.0 | 610 | 6 | Weak |
| Glass (1.0mm) | 120 | 5.5 | 480 | 18 | Yes |
Table 2: Optimization Matrix for Environmental Soil Sample (High Clay Content)
| Condition | Bead Beating Cycle | Estimated Power (W) | Microbial Cell Count (Cell Rupture %) | DNA Shearing Index (1=Low, 5=High) |
|---|---|---|---|---|
| A | 3 x 40s, ice pause | 55 | ~65% | 2 |
| B | 2 x 60s, ice pause | 60 | ~80% | 3 |
| C | 1 x 180s, no pause | 65 | ~85% | 5 |
Detailed Experimental Protocol for Optimization
Title: Protocol for Systematic Optimization of Bead Beating in DNA Extraction from Dormant Microbes.
Materials: See "Research Reagent Solutions" below.
Method:
- Sample Preparation: Aliquot identical masses (e.g., 0.5 g) of homogenized environmental sample or pellets of cultured dormant cells (e.g., Bacillus spores) into sterile, DNase-free 2ml bead beating tubes.
- Bead & Buffer Addition: Add 0.5g of your test bead type (e.g., 0.1mm zirconia) to each tube. Pipette 1ml of pre-chilled lysis buffer (e.g., containing guanidine HCl, Tris, EDTA, and Sarkosyl) to each tube.
- Bead Beating Matrix: Set up tubes in a full factorial design: varying times (e.g., 30, 60, 90, 120 seconds) and machine settings (e.g., Homogenizer speeds: 4, 5, 6 m/s). Perform each condition in triplicate.
- Processing: Secure tubes in the bead beater. Process for the specified time. If no cooling unit is present, use pulsed cycles with intervals on ice.
- Post-Lysis: Immediately centrifuge tubes at 14,000 x g for 2 min at 4°C to pellet beads and debris. Transfer supernatant to a clean tube.
- DNA Purification: Follow your chosen silica-column or magnetic-bead purification protocol. Elute in 50-100 µL of TE buffer or nuclease-free water.
- Analysis:
- Yield: Quantify DNA using a fluorescent assay (e.g., Qubit dsDNA HS Assay).
- Size: Analyze 1 µL on a 0.8% agarose gel or a Bioanalyzer/TapeStation.
- Quality: Perform PCR targeting a long microbial gene fragment (e.g., ~1.5 kb region of 16S rRNA gene) and visualize amplicon intensity on a gel.
Visualizations
Decision Pathway for Bead Beating Troubleshooting
DNA Extraction Workflow for Dormant Cells
The Scientist's Toolkit: Research Reagent Solutions
| Item | Function & Rationale |
|---|---|
| 0.1mm Zirconia/Silica Beads | The gold-standard for microbial lysis. The hard, irregularly shaped, tiny beads create maximum shear force for cracking tough cell walls of Gram-positives and spores. |
| Lysis Buffer with Chaotropic Salt (e.g., Guanidine HCl) | Denatures proteins and nucleases immediately upon cell rupture, protecting nucleic acids from degradation. Also facilitates subsequent binding to silica. |
| Lysozyme & Mutanolysin | Enzymatic pre-treatment to hydrolyze peptidoglycan in bacterial cell walls, weakening the structure and allowing milder, less shearing mechanical lysis. |
| Phenol:Chloroform:Isoamyl Alcohol (25:24:1) | For manual purification post-bead beating. Effectively removes proteins and lipids from lysates, especially useful for complex environmental samples. |
| Magnetic Silica Beads | Enable high-throughput, semi-automated purification. DNA binds in the presence of chaotropic salts, allowing rapid magnetic separation and washing. |
| DNase/Rnase-Free Lo-Bind Tubes | Minimize adsorption of low-concentration DNA to tube walls and prevent introduction of nucleases that can degrade sheared DNA fragments. |
| Pulsed-Field Gel Electrophoresis (PFGE) System or Bioanalyzer | Critical equipment for accurately assessing DNA fragment size distribution after bead beating, beyond the resolution of standard agarose gels. |
Technical Support Center
Troubleshooting Guide & FAQs
Q1: Our downstream PCR for extracted DNA from dormant bacterial spores is consistently failing. The extraction yield seems adequate, but no amplification occurs. What could be the issue? A: This is a classic symptom of inefficient pre-treatment for dormancy breaking. Dormant spores and other resilient microbial forms have complex coats and membranes that standard lysis buffers cannot penetrate. The DNA is physically trapped. You must incorporate a heat activation step (e.g., 65-80°C for 15-30 minutes in a water bath) prior to lysis to weaken the spore coat. Follow this with a chemical primer, such as a lysozyme or mutanolysin incubation, to enzymatically degrade the cortical peptidoglycan. Without these steps, lysis is incomplete.
Q2: When using a chemical primer (lysozyme) on environmental samples for dormant microbe DNA extraction, we get high levels of contaminating RNA and protein. How can we improve purity? A: Lysozyme is a protein itself and can co-precipitate with nucleic acids. To mitigate this:
- Ensure you are using molecular biology-grade, DNase/RNase-free lysozyme.
- Include a robust proteinase K and RNase A treatment after the lysozyme step and before the main lysis. The workflow should be: Heat Activation → Lysozyme Incubation → Proteinase K/RNase A Incubation → Standard Lysis/Binding.
- Increase the number of wash steps with a wash buffer containing ethanol. Monitor purity ratios (A260/A280 and A260/A230) spectrophotometrically.
Q3: Does the heat activation temperature vary for different types of dormant microorganisms (e.g., spores vs. persister cells)? A: Yes, critically. Optimal heat activation is strain and dormancy-form dependent. Excessive heat can cause DNA fragmentation, while insufficient heat won't break dormancy. See the table below for empirically derived guidelines.
Table 1: Optimized Pre-Treatment Parameters for Dormant Microbes
| Dormant Form | Example Organism | Recommended Heat Activation | Recommended Chemical Primer(s) | Typical Yield Increase vs. No Pre-Tx* |
|---|---|---|---|---|
| Bacterial Endospores | Bacillus subtilis | 70°C for 25 min | Lysozyme (10 mg/mL, 37°C, 30 min) | 300-500% |
| Mycobacterial Persisters | Mycobacterium smegmatis | 65°C for 15 min | Lysozyme + Proteinase K combo | 200-350% |
| Fungal Spores | Aspergillus niger | 80°C for 10 min | Chitinase (2 U/µL, 30°C, 60 min) | 150-250% |
| VBNC Gram-negative Bacteria | Escherichia coli (VBNC) | 40°C for 20 min | EDTA pre-treatment (chelator) | 400-700% |
Yield increase is for total DNA yield and is highly protocol-dependent. Data synthesized from recent literature (2023-2024).
Q4: Can we combine multiple chemical primers in a single step to save time? A: It depends on the buffer compatibility and optimal activity conditions (pH, temperature) of each enzyme. For example, lysozyme and mutanolysin can often be combined in a Tris-EDTA buffer at pH 8.0. However, combining a lytic enzyme with a chaotropic agent (like guanidine thiocyanate) will denature the enzyme. Protocol: Sequential vs. Combined Priming.
- Sequential (Recommended): Perform heat activation. Cool sample to appropriate temperature for Enzyme A. Wash or buffer-exchange if needed. Add Enzyme B in its optimal buffer.
- Combined (Riskier): Only combine enzymes after confirming they are active in the same buffer and temperature. Test on a control sample first. A common combo is lysozyme (10 mg/mL) and proteinase K (0.5 mg/mL) in TE buffer at 37°C for 60 min.
Experimental Protocol: Validating Pre-Treatment Efficiency
Title: Protocol for Comparative Analysis of Pre-Treatment on B. subtilis Spore DNA Yield.
Objective: To quantify the individual and synergistic effects of heat activation and lysozyme priming on DNA extraction efficiency from dormant bacterial spores.
Materials:
- Purified Bacillus subtilis spores (1 x 10^8 CFU/mL suspension)
- Heat block or water bath (accurate to ±1°C)
- Lysozyme solution (10 mg/mL in 10 mM Tris-HCl, pH 8.0)
- Standard commercial DNA extraction kit (e.g., silica-column based)
- Spectrophotometer/Nanodrop and Qubit fluorometer.
Methodology:
- Sample Preparation: Aliquot 1 mL of spore suspension into four 1.5 mL microcentrifuge tubes (Samples A-D).
- Pre-Treatment:
- Sample A (Control): No pre-treatment. Proceed to step 3.
- Sample B (Heat Only): Incubate at 70°C for 25 min. Cool on ice 2 min.
- Sample C (Lysozyme Only): Add 50 µL lysozyme solution. Incubate at 37°C for 30 min.
- Sample D (Combined): Incubate at 70°C for 25 min. Cool. Add 50 µL lysozyme solution. Incubate at 37°C for 30 min.
- DNA Extraction: Follow the standard protocol of your chosen DNA extraction kit from the lysis step forward for all samples.
- Quantification & Analysis: Elute DNA in 50 µL elution buffer. Measure concentration using a fluorometer (Qubit) for accuracy. Calculate yield per 10^8 spores. Perform downstream PCR with a universal 16S rRNA gene target to assess amplifiability.
Diagrams
Title: DNA Extraction Workflow with Pre-Treatment Decision
Title: Mechanism of Spore Pre-Treatment for DNA Access
The Scientist's Toolkit: Research Reagent Solutions
Table 2: Essential Materials for Dormancy Breakage Pre-Treatments
| Item | Function in Pre-Treatment | Key Considerations for Dormancy Research |
|---|---|---|
| Precision Dry Bath/Water Bath | Provides accurate, uniform heat activation. Critical for reproducible weakening of spore coats/cysts. | Look for models with high stability (±0.5°C) and a large block for multiple samples. |
| Molecular Biology-Grade Lysozyme | Enzymatically degrades peptidoglycan in bacterial cell walls and spore cortices. | Must be DNase/RNase-free. Aliquot and store at -20°C to prevent self-degradation. |
| Chitinase | Degrades chitin in fungal spore and cyst walls. Essential for non-bacterial dormant forms. | Activity can vary by source. Test different units/incubation times for your sample. |
| Proteinase K (RNase-free) | Broad-spectrum protease. Digests proteins and inactivates nucleases after cell wall is compromised. | Vital for removing contaminating enzymes and proteins, improving DNA purity. |
| Chelating Agents (EDTA, EGTA) | Binds metal ions, destabilizing outer membranes of Gram-negative/VBNC cells and inhibiting DNases. | Use in the pre-treatment buffer to enhance the effect of lytic enzymes. |
| Thermostable Lysis Beads (e.g., Zirconia/Silica) | Used for mechanical disruption in bead beaters after pre-treatment. | Combine chemical pre-treatment with mechanical lysis for the most resilient structures. |
| Fluorometric DNA Quantitation Kit (e.g., Qubit dsDNA HS) | Accurately measures low concentrations of DNA in the presence of common contaminants (RNA, salts). | Spectrophotometry (Nanodrop) often overestimates yield from complex environmental extracts. |
Benchmarking Performance: How to Validate Your Extraction Protocol's Efficiency
Technical Support Center
Troubleshooting Guides & FAQs
Q1: Our qPCR amplification curves for environmental DNA (from dormant microbe extraction) are irregular or show late Ct values. What could be the cause and how can we fix it? A: This is often due to PCR inhibition from co-extracted humic substances or salts. To troubleshoot:
- Check Extraction Purity: Measure A260/A230 ratio via spectrophotometry. A ratio below 2.0 indicates organic contaminant carryover.
- Use a Dilution Series: Dilute template DNA (1:5, 1:10). If Ct decreases or curve shape improves, inhibition is confirmed.
- Implement a Robust Spike-In Control: Add a known quantity of exogenous, non-competitive DNA (e.g., from Arabidopsis thaliana) prior to DNA extraction. Calculate the percent recovery. Low recovery (<50%) confirms inefficient extraction or inhibition.
- Purify Again: Use a silica-column-based clean-up kit or add a wash step with inhibitors removal reagents.
Q2: The variance between technical replicates of our spike-in control qPCR is high. How do we improve precision? A: High variance often stems from pipetting errors of low-volume spike-in solutions.
- Solution 1: Prepare a large, homogeneous master mix of your spike-in control at a working concentration, aliquot, and store at -20°C.
- Solution 2: Use a commercial synthetic DNA spike (e.g., gBlocks, Synthetic Oligos) at a concentration that yields a Ct between 20-25 cycles for optimal precision.
- Solution 3: Always include at least three technical replicates for the spike-in channel. CV should be <5% for Ct values.
Q3: How do we accurately quantify absolute microbial load in a soil sample when extraction efficiency is low and variable? A: You must normalize your target gene copies (e.g., 16S rRNA) using an extraction/internal process control.
- Protocol: Spike a known, high copy number (e.g., 10^6 copies) of a synthetic, non-native DNA sequence into each sample lysate immediately at the start of the DNA extraction protocol.
- Perform parallel qPCR assays: one for the target microbial gene and one for the spike-in control.
- Calculation:
Absolute Quantity (copies/g soil) = (Target Gene Copies Measured) / (Spike-in Copies Recovered) * (Spike-in Copies Added). This corrects for losses during extraction and purification.
Q4: In multiplex qPCR for a target gene and an internal standard, how do we prevent signal crossover (bleed-through)? A: Bleed-through between fluorescence channels requires validation.
- Troubleshooting Steps:
- Run Singleplex Controls: Run each probe/assay alone in the multiplex wells to check for its signal in the other's detection channel.
- Optimize Probe Chemistry: Use spectrally distinct dyes (e.g., FAM for target, HEX or CY5 for spike-in) with your instrument's filter sets.
- Adjust Concentrations: Lower the concentration of the brighter probe to balance signals and reduce background.
- Thermal Cycling: Ensure the annealing/extension step is optimal for both primer sets; a two-step protocol can sometimes help.
Data Presentation
Table 1: Comparison of Spike-In Control Types for Dormant Microbe DNA Studies
| Spike-In Type | Added At Stage | Purpose | Advantage | Disadvantage | Best For |
|---|---|---|---|---|---|
| Exogenous Synthetic DNA (gBlocks) | Lysis Buffer Start | Control for extraction & purification efficiency | Non-homologous, avoids competition; highly quantifiable | Does not control for cell lysis efficiency | All sample types, especially high-inhibition soils |
| Whole Cell Control (e.g., Pseudomonas spp.) | Sample Homogenate | Control for mechanical/chemical lysis efficiency | Mimics actual microbial cell lysis | May not represent dormancy structures (spores); can grow | Studies focusing on lysis protocol optimization |
| Exogenous RNA (External RNA Controls) | Lysis Buffer | Control for RNA extraction & reverse transcription | Essential for metatranscriptomics of dormant cells | RNA is labile; requires careful handling | Active vs. dormant community gene expression |
| Competitive Internal Standard | PCR Reaction | Control for PCR inhibition only | Simple to implement | Does not control for extraction losses; can compete with target | When extraction efficiency is known to be high & consistent |
Table 2: Impact of Spike-In Normalization on Calculated Gene Abundance in Peat Soil
| Sample | Target 16S rRNA Copies (Raw qPCR) / g | Spike-In Copies Added | Spike-In Copies Recovered | % Recovery | Normalized 16S rRNA Copies / g (Corrected for Recovery) |
|---|---|---|---|---|---|
| Peat Core A | 1.5 x 10^8 | 1.0 x 10^6 | 2.5 x 10^5 | 25% | 6.0 x 10^8 |
| Peat Core B | 2.1 x 10^8 | 1.0 x 10^6 | 6.0 x 10^5 | 60% | 3.5 x 10^8 |
| Difference (Raw) | 40% higher in B | 42% lower in B (True Value) |
Experimental Protocols
Protocol 1: Validating DNA Extraction Efficiency Using a Non-Competitive Synthetic Spike-In Objective: To accurately determine the absolute recovery efficiency of DNA from an environmental sample containing dormant microorganisms. Materials: Sample, DNA extraction kit, synthetic DNA spike (e.g., 1x10^6 copies/µL in TE buffer), qPCR master mix, primers/probes for spike. Procedure:
- Spike Addition: Add 10 µL of the synthetic DNA spike solution directly to the sample (e.g., 0.25g soil) in the initial lysis tube. Vortex thoroughly.
- DNA Extraction: Complete the full DNA extraction and purification protocol according to the manufacturer's instructions.
- Elution: Elute DNA in a final volume of 100 µL.
- Quantification: a. Perform qPCR on the eluted DNA to quantify the amount of recovered spike-in using the spike-specific assay. b. Perform qPCR to quantify the target microbial gene (e.g., bacterial 16S rRNA).
- Calculation: Extraction Efficiency (%) = (Copies of Spike Recovered / Copies of Spike Added) * 100. Normalized Target Copies = (Raw Target Copies Measured / Extraction Efficiency) * 100.
Protocol 2: Multiplex qPCR for Target and Internal Process Control Objective: To simultaneously amplify and detect a target microbial gene and an internal spike-in control in a single well. Materials: Extracted DNA (with pre-added spike), qPCR master mix for multiplexing, forward/reverse primers for Target and Spike, TaqMan probes for Target (FAM-labeled) and Spike (HEX/CY5-labeled). Procedure:
- Reaction Setup: In a 20 µL reaction: 10 µL 2x Multiplex qPCR Master Mix, 1 µL each of Target F/R Primer Mix (final 400 nM each), 1 µL each of Spike F/R Primer Mix (final 400 nM each), 0.5 µL each of Target and Spike Probes (final 100 nM each), 5 µL template DNA, nuclease-free water to volume.
- Thermal Cycling:
- Stage 1: 95°C for 3 min (Polymerase Activation).
- Stage 2 (40 cycles): 95°C for 15 sec (Denaturation), 60°C for 60 sec (Combined Annealing/Extension - acquire fluorescence).
- Analysis:
- Set distinct fluorescence detection channels for FAM and HEX.
- Analyze Ct values from respective channels.
- Use the Spike Ct to confirm consistent recovery across samples before comparing Target Ct values.
Mandatory Visualization
Title: Workflow for Spike-In Normalized qPCR Quantification
Title: Logic of Spike-In Controls for Solving Quantification Problems
The Scientist's Toolkit: Research Reagent Solutions
| Item | Function in Quantitative Validation | Key Consideration for Dormant Microbe Research |
|---|---|---|
| Synthetic DNA Fragments (gBlocks, Gene Fragments) | Non-competitive exogenous spike-in control. Added pre-extraction to calculate percent recovery. | Must be phylogenetically distinct from sample to avoid false positives in downstream analysis. |
| Inhibitor-Resistant DNA Polymerase | Enzyme for qPCR amplification. Reduces sensitivity to humic acids and salts common in environmental DNA. | Critical for amplifying damaged or low-copy DNA from ancient or dormant cells. |
| Multiplex qPCR Master Mix | Buffer system optimized for simultaneous amplification of multiple targets. | Allows co-amplification of target gene and internal control in one well, conserving sample and reducing well-to-well variation. |
| TaqMan Hydrolysis Probes (Dye-Labeled) | Sequence-specific probes providing real-time detection and high specificity. | FAM/HEX/CY5 labels allow multiplexing. Required for distinguishing spike-in from target in complex extracts. |
| Magnetic Bead-Based DNA Clean-Up Kits | Post-extraction purification to remove PCR inhibitors. | More consistent than alcohol precipitation for improving qPCR efficiency from difficult samples. |
| Digital PCR (dPCR) Assay Kits | Absolute quantification without a standard curve. Partitioning-based method. | Emerging as a superior method for quantifying spike-in and target with high precision, especially at low concentrations. |
Technical Support Center: Troubleshooting & FAQs
Q1: During bead-beating lysis for a defined community, my subsequent qPCR shows highly variable 16S rRNA gene copy numbers between replicates. What could be the cause? A: This is a classic sign of inconsistent lysis efficiency or bead degradation. Overly aggressive bead-beating can shatter beads, creating fines that interfere with downstream purification and cause inhibitor carryover. Ensure you use high-quality, uniform ceramic or silica beads. Follow a standardized protocol: use a fixed beating time (e.g., 2 x 45 seconds with 5-minute ice cooling between cycles) and constant frequency (e.g., 6.5 m/s). For dormant spores in the community, a brief enzymatic pre-treatment (e.g., lysozyme for 15 min at 37°C) before bead-beating can homogenize cell wall resistance.
Q2: My DNA yield from a defined community with Gram-positive members is low using a common silica-column kit. How can I improve recovery? A: Standard kits often optimize for Gram-negatives. The robust peptidoglycan layer of Gram-positives and dormant endospores requires enhanced lysis.
- Protocol Adjustment: Incorporate a pre-lysis step with mutanolysin (200 U/mL, 37°C for 30 min) alongside lysozyme.
- Buffer Modification: Add 1% (v/v) β-mercaptoethanol to the standard lysis buffer to disrupt disulfide bonds in complex cell walls.
- Positive Control: Always spike your community with a known quantity of an exogenous control (e.g., Pseudomonas fluorescens if not present) to differentiate between lysis failure and purification loss.
Q3: I suspect my DNA extract from a spore-rich community contains persistent PCR inhibitors. How can I identify and remove them? A: Inhibitors from complex lysis (e.g., humic acids, proteins, polysaccharides) are common. Perform a 1:5 and 1:10 dilution of your template in a qPCR assay. A significant improvement in amplification efficiency (lower Cq) with dilution confirms inhibition. For removal, consider:
- Gel Electrophoresis & Cutting: Size-selection after electrophoresis can remove small inhibitors.
- Alternative Purification: Switch to a kit designed for soil or stool samples, which often contain inhibitor-removal resins.
- Post-Extraction Clean-Up: Use a polyvinylpolypyrrolidone (PVPP) spin column or add 5 mM ethylenediaminetetraacetic acid (EDTA) to chelate metal co-factors of enzymes.
Q4: When evaluating extraction methods, what quantitative metrics should I track for a fair comparison? A: Track the following metrics and summarize them in a table for clear comparison:
Table 1: Key Metrics for DNA Extraction Method Evaluation on Defined Microbial Communities
| Metric | Measurement Method | Indicates |
|---|---|---|
| Total DNA Yield | Fluorometry (Qubit, PicoGreen) | Overall mass recovery. Critical for biomass-scarce dormant cells. |
| Purity (A260/A280) | Spectrophotometry (NanoDrop) | Protein contamination (ideal: 1.8-2.0). |
| Purity (A260/A230) | Spectrophotometry | Salt/carbohydrate inhibitor contamination (ideal: >2.0). |
| Representative Yield | qPCR of a universal 16S rRNA gene target | Amplifiable gene copy number. Measures inhibitor presence. |
| Community Bias | 16S rRNA gene amplicon sequencing vs. expected input | Lysis bias against Gram-positives, spores, or thick capsules. |
| Fragment Size | Genomic DNA TapeStation/Bioanalyzer | Shearing damage from aggressive lysis. |
Q5: Can you provide a standard protocol for evaluating extraction methods on a defined community containing dormant spores? A: Experimental Protocol: Method Comparison for Communities with Dormant Cells
- Community Construction: Create a defined mock community (e.g., from ATCC strains) containing Gram-negative (E. coli), Gram-positive (B. subtilis vegetative cells), and dormant (B. subtilis endospores, Clostridium spp.) organisms in known ratios (e.g., 40:40:20 cell equivalents).
- Spore Purification: For spore stocks, use repeated centrifugation/washing with lysozyme and DNAse to eliminate vegetative cells and free DNA.
- Extraction Methods: Apply 3-4 different extraction methods in parallel (n=5 replicates each).
- Method A: Commercial silica-column kit (baseline).
- Method B: Bead-beating enhanced kit (e.g., PowerSoil).
- Method C: Enzymatic + thermal lysis (95°C with SDS) followed by CTAB purification.
- Method D: A modified Method B with an enzymatic pre-lysis step.
- Analysis: Quantify yield and purity (Table 1). Perform qPCR with universal primers and strain-specific primers to assess bias. Sequence to confirm community profile fidelity.
The Scientist's Toolkit: Research Reagent Solutions
Table 2: Essential Reagents for Dormant Microbe DNA Extraction Studies
| Reagent/Solution | Function | Key Consideration |
|---|---|---|
| Lysozyme | Degrades peptidoglycan layer of Gram-positive bacteria. | Essential for pre-treatment; activity is pH and buffer dependent. |
| Mutanolysin | Cleaves specific bonds in peptidoglycan (complements lysozyme). | Crucial for lysing stubborn Gram-positive cells like Micrococcus. |
| Proteinase K | Broad-spectrum serine protease; digests proteins and inactivates nucleases. | Must be added post-lysozyme (as it degrades lysozyme); requires SDS and heat. |
| CTAB (Cetyltrimethylammonium bromide) | Ionic detergent effective for lysing plants/microbes; precipitates polysaccharides. | Used in complex polysaccharide-rich samples; requires chloroform extraction. |
| PVPP (Polyvinylpolypyrrolidone) | Binds and removes phenolic compounds and humic acid inhibitors. | Added to lysis buffer or used as a spin column post-extraction. |
| β-Mercaptoethanol | Reducing agent; breaks disulfide bonds in proteins. | Enhances lysis of resistant structures; add fresh to lysis buffer. |
| SDS (Sodium Dodecyl Sulfate) | Ionic detergent that solubilizes membranes and denatures proteins. | Standard for comprehensive lysis; must be removed before silica binding. |
| Exogenous Internal Control (e.g., P. fluorescens cells) | Spiked-in organism not in the community to monitor extraction efficiency. | Allows normalization for process losses across different methods. |
Visualizations
Title: DNA Extraction Method Comparison Workflow
Title: Lysis Pathways for Dormant Spores and Vegetative Cells
Troubleshooting Guides & FAQs
Q1: My 16S rRNA gene amplicon sequencing shows very low read counts, but the DNA quantification pre-PCR was adequate. What could be the issue?
A: This is a common issue in dormant microbe research where inhibitor carryover is frequent. Low read counts despite good Qubit/Fluorometer readings often indicate PCR inhibition or suboptimal primer binding to target taxa.
- Troubleshooting Steps:
- Re-assess DNA Purity: Check A260/230 and A260/280 ratios. A low A260/230 (<1.8) suggests polysaccharide or humic acid contamination common in environmental/dormant cell extracts.
- Perform Inhibition Test: Set up a standardized qPCR assay with a known control template (e.g., gBlocks) spiked into your extracted DNA and a clean buffer. A significant Ct shift (>3 cycles) confirms inhibition.
- Dilution PCR: Dilute your template DNA 1:10 and 1:100. Amplification success at higher dilutions confirms the presence of PCR inhibitors. Consider re-cleaning with inhibitor-removal kits (e.g., OneStep PCR Inhibitor Removal Kit) or optimizing extraction with more stringent wash steps.
- Protocol: Inhibition Test qPCR:
- Master Mix (per reaction): 10 µL 2X SYBR Green Master Mix, 0.8 µL forward primer (10 µM), 0.8 µL reverse primer (10 µM), 1 µL control template (10^4 copies/µL), X µL sample DNA (or H2O for control), up to 20 µL with nuclease-free water.
- Cycling Conditions: 95°C for 3 min; 40 cycles of 95°C for 15 sec, 60°C for 30 sec (with plate read); melt curve 65°C to 95°C, increment 0.5°C.
Q2: My metagenomic libraries have extremely high duplication rates (>80%). How can I improve this for low-biomass samples from dormant microorganisms?
A: High duplication rates stem from insufficient starting DNA diversity, often due to low input mass or over-amplification during library prep.
- Solutions:
- Increase Input Mass: Pool multiple DNA extractions from the same sample condition, if possible.
- Optimize Fragmentation & Size Selection: Use Covaris or focused ultrasonication for consistent fragment distribution. Tighten size selection beads ratio to target a narrower insert size (e.g., 350-450bp).
- Reduce PCR Cycles: Use library prep kits designed for low-input (e.g., Nextera XT) and minimize PCR cycles. Perform a qPCR quantification after adapter ligation to determine the minimum necessary amplification cycles.
- Employ Duplex-Specific Nuclease (DSN) Normalization: For metagenomes, DSN normalization can reduce abundant ribosomal sequences and increase coverage evenness before sequencing.
Q3: After sequencing, my 16S data is dominated by a single operational taxonomic unit (OTU) or amplicon sequence variant (ASV). Is this biological or technical?
A: In dormant microbe studies, this can be either a true bloom of a resuscitated taxon or a contamination/artifact.
- Diagnostic Checklist:
- Compare to Extraction Blanks: Is the dominant sequence present in your negative control (extraction blank)? If yes, it's likely a kit or laboratory contaminant (e.g., Pseudomonas, Bradyrhizobium).
- Check Primer Specificity: Use in silico tools (e.g., TestPrime) against the SILVA database. Your primer pair may have biased affinity.
- Cross-Reference with Metagenomic Data: If available, does your shotgun data show a similar dominance at the genus level? Metagenomics is less prone to this amplification bias.
- Technical Replication: Was the dominance observed across independent PCR replicates from the same DNA extract?
Q4: What are the critical quality metrics for metagenomic assembly from complex communities containing dormant cells?
A: Key metrics assess completeness, contamination, and strain diversity. See Table 1.
Table 1: Critical Quality Metrics for Metagenome-Assembled Genomes (MAGs)
| Metric | Tool/Source | Optimal Range | Interpretation for Dormant Microbe Research |
|---|---|---|---|
| Completeness | CheckM2, BUSCO | >90% (High Quality) | Indicates sufficient sequencing depth to capture near-complete genome, crucial for identifying dormancy genes. |
| Contamination | CheckM2 | <5% | High contamination suggests co-assembly of similar strains, can mislead metabolic interpretations. |
| Strain Heterogeneity | CheckM2 | Low | High heterogeneity may indicate a mixed population of active and dormant states of related strains. |
| N50 (contigs) | Assembly stats | As high as possible | Longer contigs improve gene context and pathway reconstruction (e.g., sporulation operons). |
| rRNA Gene Presence | Barrnap | 1-2 copies of 5S,16S,23S | Confirms a bacterial genome; absence may indicate fragmented assembly. |
| Transfer RNA Presence | tRNAscan-SE | >18 | Indicates good functional assembly; essential for metabolic profiling. |
Experimental Protocols
Protocol: Standardized 16S rRNA Gene Amplicon Library Preparation (V4 Region)
- Primers: 515F (5′-GTGYCAGCMGCCGCGGTAA-3′), 806R (5′-GGACTACNVGGGTWTCTAAT-3′)
- Step 1: Primary PCR. 25 µL reactions: 12.5 µL 2X KAPA HiFi HotStart ReadyMix, 1 µL each primer (10 µM), 1-10 ng template DNA (volume adjusted), nuclease-free water to 25 µL.
- Cycling: 95°C 3 min; 25-30 cycles of 95°C 30s, 55°C 30s, 72°C 30s; 72°C 5 min.
- Step 2: Amplicon Cleanup. Use magnetic beads (e.g., AMPure XP) at a 0.8x ratio to remove primers and fragments <300bp.
- Step 3: Indexing PCR. Attach dual indices and sequencing adapters using a kit (e.g., Nextera XT Index Kit). Use 5-8 cycles.
- Step 4: Final Pool Cleanup & Normalization. Clean pooled libraries with a 0.9x bead ratio. Quantify by qPCR (KAPA Library Quant Kit) and pool equimolarly.
Protocol: Shotgun Metagenomic Library Prep for Low-Biomass Input
- Kit Recommendation: Illumina DNA Prep with Bead-Linked Transposomes.
- Step 1: Tagmentation. Combine 1-100 ng DNA (in 20 µL) with 10 µL TD Buffer and 5 µL ATM. Incubate at 55°C for 15 min. Immediately add 5 µL NT Buffer to stop.
- Step 2: PCR Amplify. Add 15 µL of a custom PCR mix: 10 µL 2X KAPA HiFi HotStart Mix, 5 µL unique i5/i7 primer mix (1 µM final). Cycle: 72°C 3 min; 98°C 30s; 5-12 cycles of 98°C 10s, 60°C 30s, 72°C 30s; 72°C 1 min.
- Step 3: Cleanup. Use a 0.7x followed by a 0.15x double-sided SPRI bead cleanup to remove short fragments and primers.
- Step 4: Quantification & Pooling. Use a fluorometric high-sensitivity assay (Qubit). Validate fragment size on Bioanalyzer (peak ~550bp). Pool libraries based on qPCR concentration.
Visualizations
Title: Workflow for Integrated 16S and Metagenomic Analysis
Title: Troubleshooting Decision Tree for Sequencing Issues
The Scientist's Toolkit: Research Reagent Solutions
Table 2: Essential Materials for Sequencing from Low-Biomass/Dormant Samples
| Item | Function | Example Product |
|---|---|---|
| Inhibitor Removal Beads/Chemicals | Binds humic acids, polyphenols, and other common environmental inhibitors carried over from harsh lysis protocols. | OneStep PCR Inhibitor Removal Kit, PVPP (Polyvinylpolypyrrolidone) |
| High-Efficiency, Low-Bias Polymerase | Critical for even amplification of diverse community DNA and for low-input library prep to minimize coverage bias. | KAPA HiFi HotStart ReadyMix (PCR), Q5 High-Fidelity DNA Polymerase |
| Magnetic Beads (SPRI) | For size selection and cleanup. Adjustable ratios are key for removing primer dimers and selecting optimal insert sizes. | AMPure XP Beads, Sera-Mag Select Beads |
| Broad-Range DNA Quantitation Kits | Accurately quantifies dilute, fragmented DNA from lysed dormant cells where traditional methods fail. | Qubit dsDNA HS Assay, AccuClear Ultra High Sensitivity dsDNA Kit |
| Library Prep Kit for Low DNA Input | Uses bead-linked transposomes for efficient fragmentation and adapter tagging from minimal input. | Illumina DNA Prep, Nextera XT DNA Library Prep Kit |
| Positive Control Mock Community | Contains genomic DNA from known bacteria at defined ratios. Essential for identifying technical bias in 16S sequencing. | ZymoBIOMICS Microbial Community Standard |
| Duplex-Specific Nuclease (DSN) | Normalizes cDNA/metagenomic libraries by degrading double-stranded abundant sequences, improving coverage of rare taxa. | DSN Enzyme (Evrogen) |
Technical Support Center
Troubleshooting Guides & FAQs
Q1: My DNA yield from dormant spore samples is consistently low. What are the primary culprits? A: Low yield from dormant populations (e.g., bacterial spores, persister cells) is common. Key issues include:
- Inefficient Lysis: Dormant structures have robust coats (e.g., spore coat, mycobacterial cell wall). Standard enzymatic lysis (lysozyme) is often insufficient.
- Solution: Implement a mechanical disruption step (e.g., bead beating) before enzymatic treatment. For environmental spores, a preliminary heat shock (80°C for 20 min) can weaken the coat.
- Inhibitor Co-extraction: Environmental samples (soil, sediment) contain humic acids; clinical samples (sputum) can have polysaccharides and mycolic acids.
- Solution: Use inhibitor removal columns specifically designed for your sample type. For soil, polyvinylpolypyrrolidone (PVPP) can be added to the lysis buffer. For clinical mycobacteria, incorporate a chloroform:isoamyl alcohol wash.
Q2: I am getting PCR inhibition despite good spectrophotometric DNA concentration. How do I diagnose and resolve this? A: Spectrophotometry (A260/A280) does not detect many PCR inhibitors.
- Diagnosis: Perform a spike-in assay. Add a known quantity of control DNA template to your PCR master mix, then test reactions with and without your extracted sample. Compare Ct values.
- Resolution:
- Dilution: Simply diluting the template (1:5, 1:10) can reduce inhibitor concentration below a critical threshold.
- Alternative Purification: Switch to a silica-membrane based column or magnetic bead cleanup that targets inhibitor removal over total yield.
- PCR Additives: Supplement your PCR with bovine serum albumin (BSA, 0.1-0.4 µg/µL) or betaine (0.5-1 M) to counteract inhibitors.
Q3: My extraction from clinical sputum for dormant Mycobacterium tuberculosis is biased against VBNC (Viable But Non-Culturable) cells. How can I improve inclusivity? A: Standard M. tuberculosis protocols target replicating cells. To capture dormant populations:
- Problem: N-acetyl-L-cysteine-NaOH (NALC-NaOH) decontamination can lyse VBNC cells.
- Protocol Adjustment: Reduce NaOH concentration from 2% to 1% and exposure time from 15 to 10 minutes. Follow with a neutralization buffer.
- Lysis Enhancement: After decontamination, use a lysis buffer containing both lysozyme (for peptidoglycan) and lysostaphin (for staphylococcal contaminants, if co-present) with an extended incubation (60 min at 37°C). Subsequent bead beating (0.1mm zirconia beads, 5 min) is critical to disrupt the waxy cell wall of dormant mycobacteria.
Q4: When comparing alpha diversity between environmental and clinical dormant extracts, my results are skewed. Could extraction bias be the cause? A: Yes. Different dormancy structures require different lysis forces. A single, standardized lysis method will bias results.
- Recommended Workflow: Perform parallel extractions from the same homogenized sample using:
- A gentle chemical/enzymatic lysis (for fragile VBNC cells).
- A harsh mechanical lysis (bead beating for spores, mycobacteria).
- A combination method (gentle pre-treatment followed by mechanical disruption).
- Data Interpretation: Sequence and analyze these extracts separately, then compare. Do not pool DNA prior to sequencing, as this obscures the bias. Report which method recovered which taxa.
Table 1: DNA Yield and Purity from Different Dormant Sample Types
| Sample Type | Example Source | Optimal Extraction Method | Avg. Yield (ng/µL) | A260/A280 | Key Inhibitor |
|---|---|---|---|---|---|
| Environmental Spores | Soil, Sediment | Heat Shock + Bead Beating + PVPP | 15.2 ± 4.1 | 1.72 ± 0.05 | Humic Acids |
| Clinical Spores (C. difficile) | Fecal Swab | Bead Beating + Proteinase K | 45.8 ± 12.3 | 1.85 ± 0.03 | Bile Salts, Polysaccharides |
| Environmental VBNC | Marine Water | Gentle Filtration, Lysozyme-EDTA | 5.1 ± 2.4 | 1.65 ± 0.08 | Salts, Polysaccharides |
| Clinical Dormant (M. tuberculosis) | Sputum | Mild NALC-NaOH + Bead Beating | 22.5 ± 7.6 | 1.78 ± 0.06 | Mycolic Acids, Mucin |
Table 2: Comparative Efficiency of Lysis Methods on Dormant Cells
| Lysis Method | Mechanism | Efficacy vs. Spores | Efficacy vs. VBNC | Risk of DNA Shearing |
|---|---|---|---|---|
| Chemical (SDS/Alkali) | Dissolves membranes | Low | Moderate-High | Low |
| Enzymatic (Lysozyme) | Digests cell wall | Very Low | Moderate | Very Low |
| Thermal (Heat Shock) | Weakens structures | High for some spores | Low | Moderate |
| Mechanical (Bead Beating) | Physical disruption | Very High | High (but can lyse cells) | High |
| Combination (Enz.+Mech.) | Sequential attack | Highest | Highest | Moderate |
Experimental Protocols
Protocol 1: Sequential Extraction for Environmental Dormant Communities (Soil)
- Homogenization: Suspend 0.5g soil in 1.5 mL phosphate-buffered saline (PBS). Vortex 2 min.
- Heat Shock: Incubate at 80°C for 20 minutes. Immediately place on ice.
- Mechanical Lysis: Transfer to a tube containing 0.3g of 0.1mm zirconia/silica beads. Bead beat at 6.0 m/s for 45 seconds. Chill on ice for 2 min. Repeat twice.
- Enzymatic Lysis: Add lysozyme (final conc. 10 mg/mL) and incubate at 37°C for 30 min.
- Chemical Lysis: Add SDS (final conc. 2%) and Proteinase K (0.5 mg/mL). Incubate at 56°C for 1 hour.
- Inhibitor Removal: Add 250 mg PVPP to the lysate, incubate on ice for 15 min with vortexing every 5 min.
- Purification: Follow standard phenol-chloroform-isoamyl alcohol extraction and ethanol precipitation, or use a commercial soil DNA kit column.
Protocol 2: Modified Extraction for Dormant M. tuberculosis from Sputum
- Decontamination & Concentration: Mix sputum 1:1 with 1% NaOH-NALC solution. Vortex 20 sec. Incubate at room temp for 10 min. Neutralize with phosphate buffer (pH 6.8). Centrifuge at 3000 x g for 20 min.
- Resuspension: Discard supernatant. Resuspend pellet in 1 mL TE buffer (10 mM Tris, 1 mM EDTA, pH 8.0).
- Enzymatic Lysis: Add lysozyme (5 mg/mL final) and lysostaphin (100 µg/mL final). Incubate at 37°C for 60 min.
- Mechanical Lysis: Add 0.2g of 0.1mm zirconia beads. Bead beat at 5.5 m/s for 3 x 60 sec pulses, cooling on ice between pulses.
- Chemical Lysis: Add SDS to 1% and Proteinase K to 0.5 mg/mL. Incubate at 65°C for 30 min.
- Purification: Use a commercial silica-membrane kit designed for mycobacteria or Gram-positive bacteria.
Visualizations
Dormant DNA Extraction Decision Workflow
Barriers to DNA Extraction in Dormant Cells
The Scientist's Toolkit: Research Reagent Solutions
| Item | Function in Dormant Cell Extraction |
|---|---|
| Zirconia/Silica Beads (0.1mm) | Provides mechanical shearing force critical for breaking rigid, dormant cell walls (spores, mycobacteria). |
| Polyvinylpolypyrrolidone (PVPP) | Binds and precipitates polyphenolic inhibitors (humic/fulvic acids) common in environmental samples. |
| Lysozyme | Enzyme that catalyzes the breakdown of peptidoglycan in bacterial cell walls. Often insufficient alone for dormant cells. |
| Lysostaphin | Enzyme specific for cleaving the pentaglycine bridges in staphylococcal peptidoglycan. Useful for clinical samples with co-infections. |
| Inhibitor Removal Technology Columns | Silica-membrane columns with buffers optimized to wash away specific inhibitors (salts, heme, mycolic acids) while retaining DNA. |
| Proteinase K | Broad-spectrum serine protease that degrades proteins and inactivates nucleases, crucial after mechanical disruption. |
| Betaine (PCR Additive) | PCR enhancer that reduces DNA secondary structure and can counteract the effects of co-purified inhibitors. |
| Bovine Serum Albumin (BSA) | Acts as a "competitive inhibitor" in PCR, binding to and neutralizing phenolic compounds and other inhibitors. |
Conclusion
Effective DNA extraction from dormant microorganisms is not a one-size-fits-all process but requires a tailored, barrier-aware approach. By understanding the foundational biology, implementing robust methodological workflows, proactively troubleshooting, and rigorously validating outcomes, researchers can significantly reduce bias and unlock the full diversity of microbial communities. Advancements in this area are crucial for accurate pathogen detection, understanding antibiotic persistence, exploring extreme-environment microbiomes, and developing novel antimicrobial strategies. Future directions point towards integrated, automated systems that combine physical, chemical, and enzymatic lysis with real-time quality control, ultimately bridging a critical gap in modern microbial analysis.